Summary statistics for follow-up leaver destinations, no. 5: 2023 edition
This statistical publication provides information on the follow-up destinations of 2021/22 school leavers from publicly funded secondary schools in Scotland.
This document is part of a collection
Chapter 2: School leaver follow-up destinations
- 93.5 per cent of 2021/22 school leavers were in a positive follow-up destination – an increase from 93.2 per cent in 2020/21 and the highest proportion since consistent records began in 2009/10.
- 37.7 per cent of school leavers were in Higher Education (the most common follow-up destination), a decrease from 40.3 per cent in 2020/21.
- 31.8 per cent of school leavers were in Employment - the highest proportion since consistent records began in 2009/10.
- The percentage of school leavers in a positive follow-up destination in 2021/22 increased for leavers from both the (20 per cent) most deprived and (20 per cent) least deprived areas compared to 2020/21.
- The gap between the two groups narrowed from 7.5 percentage points in 2020/21 to 7.0 percentage points in 2021/22 – this is the narrowest the gap has been since consistent records began in 2009/10.
As described in section 1.2, the 2019/20, 2020/21 and 2021/22 figures on school leavers' follow-up destinations will be impacted by the coronavirus pandemic (COVID-19). The pandemic will have affected the choices made by, and opportunities available to, leavers in these years.
The impacts of the pandemic should be kept in mind when interpreting changes between 2019/20, 2020/21, 2021/22 and other years.
2.1 Destinations
Table 1 shows that 93.5 per cent of all 2021/22 school leavers were in a positive follow-up destination. This was higher than for 2020/21 leavers (93.2 per cent), and is the highest proportion since consistent records began in 2009/10. (A time series from 2009/10 is available in the supplementary tables). The proportion of 2021/22 leavers in an 'other' follow-up destination is therefore the lowest since consistent records began, at 6.5 per cent.
Table 1 also shows that 37.7 per cent of 2021/22 leavers were in Higher Education (the most common follow-up destination). This is lower than for 2020/21 leavers (40.3 per cent) and is the lowest proportion since 2015/16.
The percentage of school leavers in Further Education in 2021/22 was 20.7 per cent. This is the second lowest proportion since 2009/10, although it is an increase from 18.3 per cent of leavers in 2020/21 (the lowest proportion since 2009/10).
The percentage of school leavers in Employment was 31.8 per cent. This is the highest proportion since 2009/10. It has increased from 31.5 per cent of 2020/21 leavers (the second highest proportion since 2009/10).
The changes in Follow-up destinations between 2020/21 and 2021/22 are similar to those seen in the Initial leaver destinations data.
The percentage of school leavers who were Unemployed (Unemployed Seeking or Unemployed Not Seeking) has increased slightly, from 5.7 per cent of 2020/21 leavers to 5.8 per cent of 2021/22 leavers.
| Destination | 2016/17 | 2017/18 | 2018/19 | 2019/20 | 2020/21 | 2021/22 |
|---|---|---|---|---|---|---|
| Higher Education | 38.3 | 39.0 | 38.4 | 42.9 | 40.3 | 37.7 |
| Further Education | 23.0 | 22.6 | 23.3 | 23.6 | 18.3 | 20.7 |
| Training | 1.5 | 1.6 | 2.3 | 3.2 | 2.3 | 2.3 |
| Employment | 28.3 | 28.3 | 28.0 | 21.3 | 31.5 | 31.8 |
| Voluntary Work | 0.5 | 0.6 | 0.5 | 0.3 | 0.4 | 0.5 |
| Activity Agreement | 1.0 | 0.9 | [z] | [z] | [z] | [z] |
| Personal Skills Development | 0.5 | 0.3 | 0.4 | 0.8 | 0.4 | 0.4 |
| Positive Destinations | 93.1 | 93.3 | 92.9 | 92.2 | 93.2 | 93.5 |
| Unemployed Seeking | 4.3 | 3.8 | 3.5 | 4.1 | 3.3 | 3.4 |
| Unemployed Not Seeking | 1.8 | 1.8 | 2.3 | 2.7 | 2.4 | 2.4 |
| Unknown | 0.7 | 1.1 | 1.3 | 1.0 | 1.0 | 0.7 |
| Other Destinations | 6.9 | 6.7 | 7.1 | 7.8 | 6.8 | 6.5 |
| Number of Leavers | 51,172 | 49,650 | 49,655 | 47,351 | 50,649 | 55,129 |
Note 1: For 2018/19 onwards, support previously recorded as Activity Agreements is recorded in the Training category. For more information see section 4.6.
Note 2: Data back to 2009/10 is available in the supplementary tables.
Note 3: The 'Unknown' status in 2018/19 and 2019/20 may be affected by local partnerships' ability to track school leavers through home visits during the COVID-19 pandemic.
2.2 Destinations by stage
For 2021/22 school leavers, those who left from S6 were the most likely to be in a positive follow-up destination and those who left in S4 were the least likely. This is the same pattern as seen in previous years. Among S6 leavers, 96.0 per cent were in a positive follow-up destination. Among S5 leavers, 90.9 per cent were in a positive follow-up destination and among S4 leavers 86.9 per cent were in a positive follow-up destination.
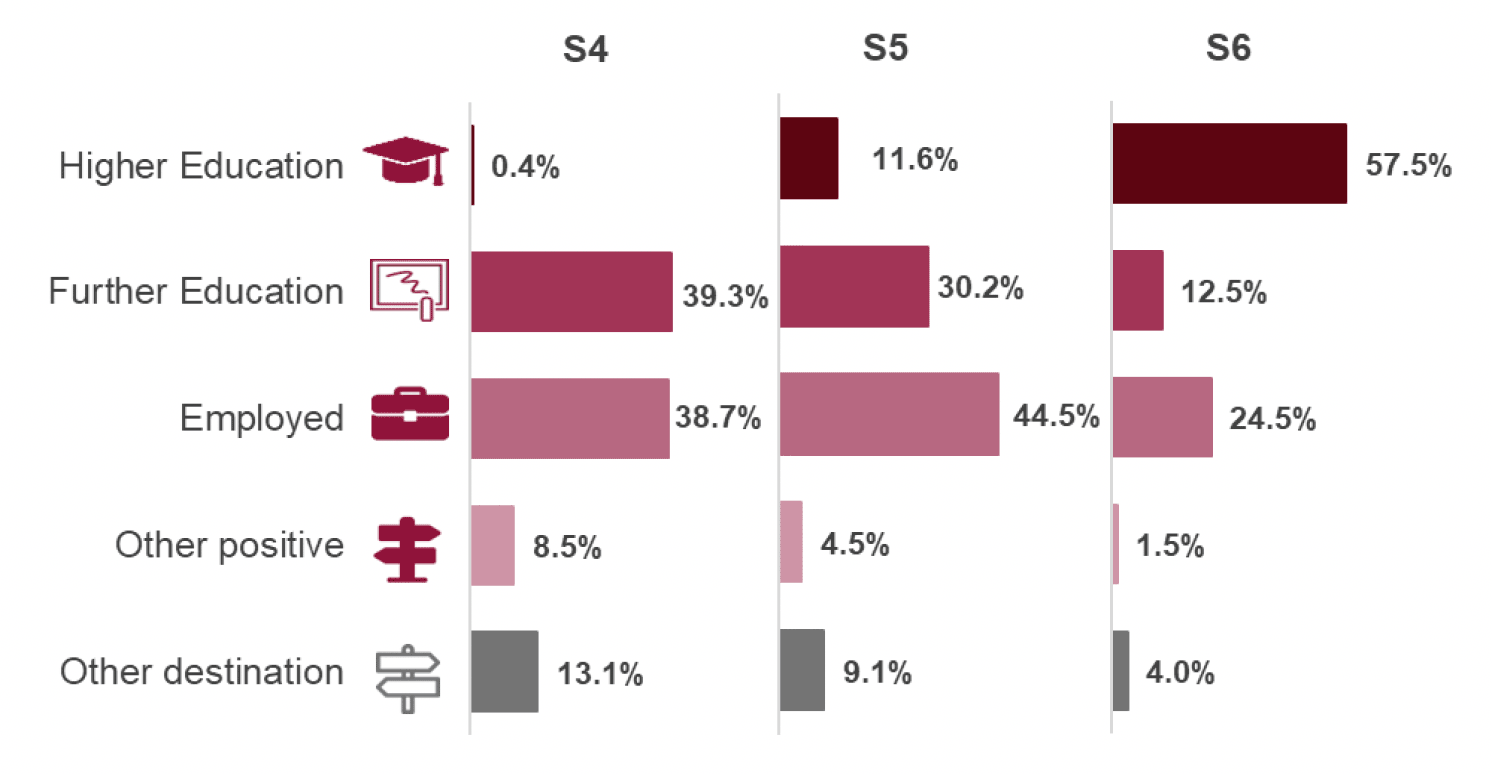
The most common follow-up destination varied by stage. Chart 1 shows:
- the majority of S6 leavers were in Higher Education (57.5 per cent);
- the most common follow-up destination for S5 leavers was Employment (44.5 per cent) followed by Further Education (30.2 per cent);
- the most common follow-up destination for S4 leavers was Further Education (39.3 per cent) followed by Employment (38.7 per cent).
The destinations by stage for 2021/22 leavers are broadly consistent with years before the COVID pandemic (i.e. with 2017/18 and 2018/19). A time series from 2017/18 is available in table L1.9 in the supplementary tables.
Note 4: Other positive includes Personal Skills Development, Training and Voluntary Work.
Note 5: Other destination includes Unemployed Seeking, Unemployed Not Seeking and Unknown.
Note 6: A small percentage of school leavers left in other stages not shown in this chart. For more information see tables C1.1a and C1.1b in the supplementary tables.
A breakdown of the number of school leavers by stage is available in tables C1.1a and C1.1b of the supplementary tables. The 2021/22 follow-up leaver cohort was substantially larger than the 2020/21 follow-up leaver cohort (55,129 in 2021/22, up from 50,649 in 2020/21). The proportion of S6 leavers decreased from 63.2 per cent in 2020/21 to 59.8 per cent in 2021/22. This is the lowest proportion of S6 leavers in the follow-up cohort since 2010/11. The low proportion of S6 leavers in 2021/22 (along with the corresponding increases at S4 and S5) may be partly responsible for the reduction in the proportion of all leavers in Higher Education in 2021/22 compared to recent years.
A small number of school leavers identified in the initial leaver cohort are excluded from the follow-up leaver cohort. Further information is available in section 4.4.
2.3 Destinations by deprivation
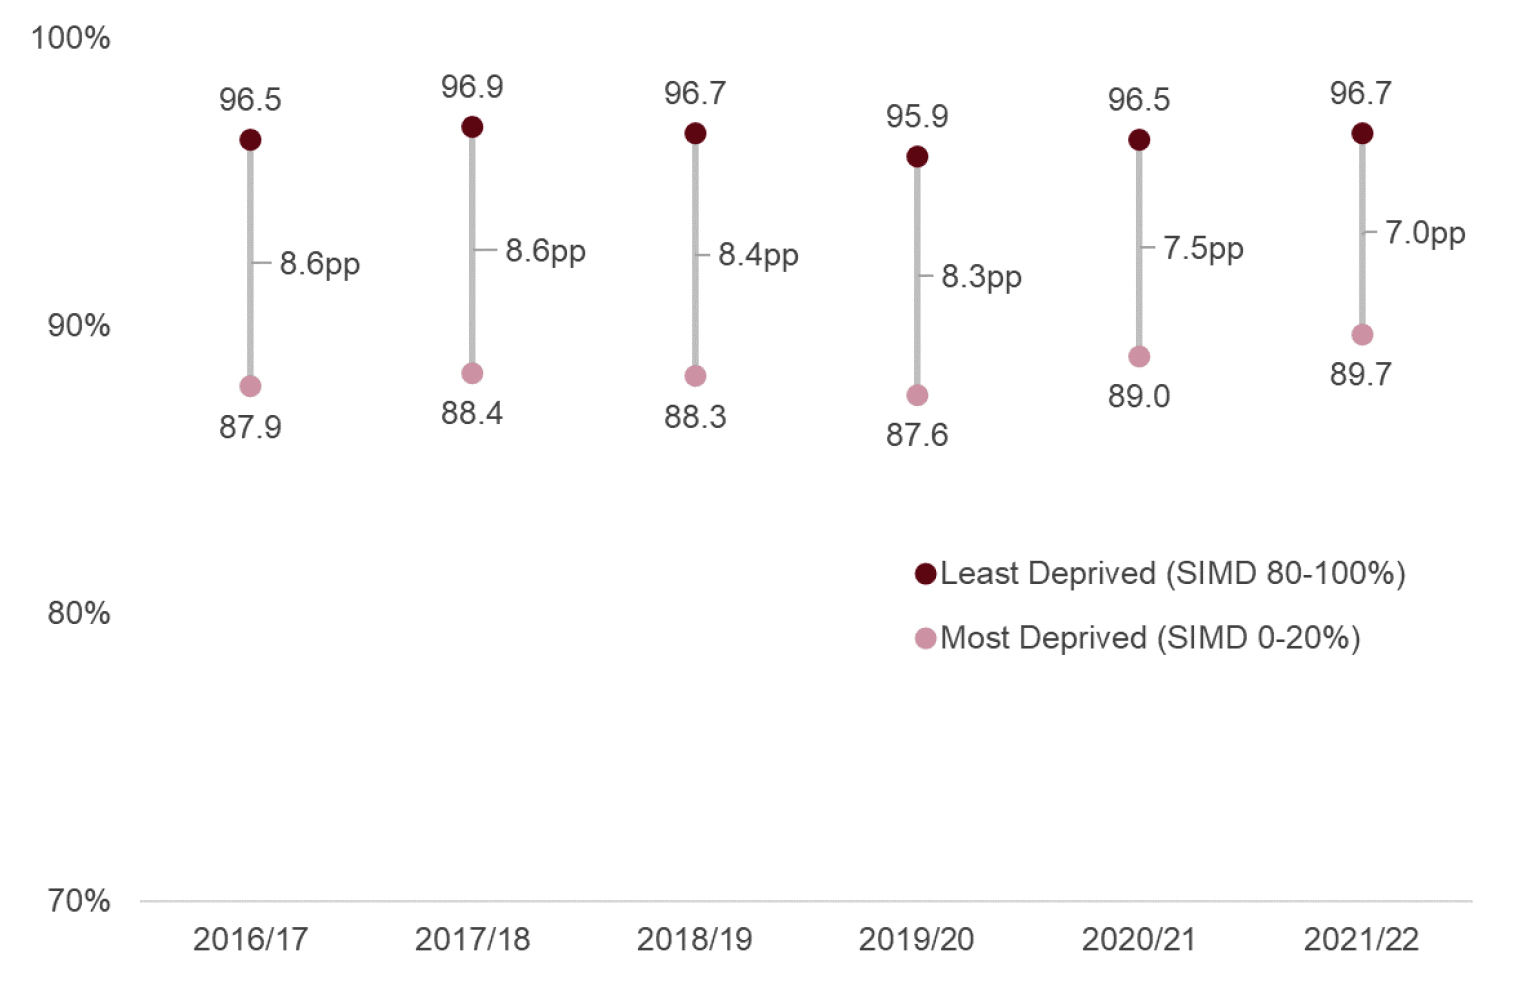
Chart 2 shows that the percentage of 2021/22 school leavers in a positive follow-up destination has increased compared to 2020/21, for leavers from both the most deprived and least deprived areas (assessed using the Scottish Index of Multiple Deprivation (SIMD) – more information in section 4.5).
The deprivation gap between the two groups has narrowed from 7.5 percentage points in 2020/21 to 7.0 percentage points in 2021/22. The percentage of leavers in a positive follow-up destination increased more among leavers from the most deprived areas (a 0.7 percentage point increase between 2020/21 and 20221/22) than among those from the least deprived areas (a 0.2 percentage point increase).
The deprivation gap between leavers from the most and least deprived areas is now the narrowest it has been since consistent records began in 2009/10. A time series from 2009/10 is available in the supplementary tables.
Note 7: pp = percentage point difference between the most and least deprived SIMD quintiles.
Note 8: Based on SIMD 2009 for 2009/10 and 2010/11, SIMD 2012 for 2011/12 to 2015/16, SIMD 2016 for 2016/17 to 2019/20, and SIMD 2020 for 2020/21 and 2021/22. More information can be found on the Scottish Index of Multiple Deprivation 2020 webpage.
Note 9: A time series from 2009/10 is available in the supplementary tables.
Note 10: Left-hand axis starts at 70 per cent.
Table 2 provides a breakdown of follow-up school leaver destinations by SIMD.
In 2021/22, the most common follow-up destination for leavers from the least deprived areas was Higher Education, at 57.7 per cent, followed by Employment at 25.4 per cent. Leavers from the least deprived areas were more likely to be in Higher Education than leavers from other areas.
The most common destination for leavers from the most deprived areas was Employment, at 31.6 per cent, followed by Further Education (28.7 per cent) and Higher Education (23.6 per cent). Leavers from the most deprived areas were more likely to be in Further Education, Training or Personal Skills Development than were leavers from other areas. They were also less likely to be in Higher Education than leavers from other areas.
Among leavers from the most deprived areas, 9.4 per cent were Unemployed (Unemployed Seeking and Unemployed Not Seeking). This compares to 2.8 per cent of leavers from the least deprived areas.
| Follow-up Destination | 0-20% (Most Deprived) | 20-40% | 40-60% | 60-80% | 80-100% (Least Deprived) | Percentage point gap | Total |
|---|---|---|---|---|---|---|---|
| Higher Education | 23.6 | 29.1 | 35.5 | 44.5 | 57.7 | 34.1 | 37.7 |
| Further Education | 28.7 | 24.7 | 20.7 | 16.5 | 12.1 | -16.6 | 20.7 |
| Training | 4.7 | 2.6 | 1.8 | 1.3 | 0.7 | -4.0 | 2.3 |
| Employment | 31.6 | 34.5 | 35.2 | 32.4 | 25.4 | -6.2 | 31.8 |
| Voluntary Work | 0.5 | 0.4 | 0.6 | 0.5 | 0.6 | 0.1 | 0.5 |
| Personal Skills Development | 0.6 | 0.5 | 0.4 | 0.4 | 0.2 | -0.4 | 0.4 |
| Positive Destinations | 89.7 | 91.8 | 94.2 | 95.6 | 96.7 | 7.0 | 93.5 |
| Unemployed Seeking | 5.6 | 4.5 | 3.0 | 2.0 | 1.5 | -4.1 | 3.4 |
| Unemployed Not Seeking | 3.8 | 2.8 | 2.2 | 1.7 | 1.3 | -2.5 | 2.4 |
| Unknown | 0.9 | 0.9 | 0.7 | 0.7 | 0.5 | -0.4 | 0.7 |
| Other Destinations | 10.3 | 8.2 | 5.8 | 4.4 | 3.3 | -7.0 | 6.5 |
| Number of Leavers | 12,136 | 10,814 | 10,515 | 11,154 | 10,510 | [z] | 55,129 |
Note 11: Based on SIMD 2020. More information can be found on the Scottish Index of Multiple Deprivation 2020 webpage.
Note 12: The percentage point gap measures the difference between leavers from the 20% most deprived and 20% least deprived areas.
The time series of destinations by SIMD (available in the supplementary tables) can be used to help understand what has caused the gap in total positive destinations between school leavers from the most and least deprived areas to narrow between 2020/21 and 2021/22.
The proportion of school leavers who were in Further Education increased across all SIMD groups between 2020/21 and 2021/22. However, the increase was bigger for leavers from the 20% most deprived areas than for leavers from the 20% least deprived areas.
At the same time, the proportion of school leavers in Higher Education decreased across all SIMD groups. However the size of this decrease was bigger for those in the least deprived areas than it was for those in the most deprived areas.
The proportion in 'other' destinations (Unemployed Seeking, Unemployed Not Seeking and Unknown) decreased for most SIMD groups between 2020/21 and 2021/22. (The one exception is for leavers from the 40%-60% quintile, where it rose by 0.1 percentage point). The size of the decrease in 'other' destinations was bigger for leavers from the 20% most deprived areas than for leavers from the 20% least deprived areas.
Together these changes help to explain why the percentage of leavers in all positive destinations increased more for leavers from the most deprived areas than for leavers from the least deprived areas. This has led to the gap between the two groups narrowing.
2.4 Destinations by pupil characteristics
Table 3 shows the percentage of school leavers in a positive follow-up destination by various characteristics. The percentage of 2021/22 school leavers in positive follow-up destinations has increased for most groups, compared to 2020/21. However there are a few groups where the percentage in a positive destination has remained the same, or decreased.
Female school leavers are more likely to be in a positive follow-up destination than male school leavers. For 2021/22 leavers, 94.0 per cent of female leavers were in a positive follow-up destination, compared to 92.9 per cent of male leavers. This is the same pattern seen in previous years.
Pupils of an Asian ethnic background, or an African/Black/Caribbean ethnic background, tend to be more likely to go on to a positive follow-up destination than those from other ethnic backgrounds. In 2021/22, 98.5 per cent of leavers from an Asian – Indian ethnic background, and 97.6 per cent of leavers from an Asian – Chinese ethnic background, were in a positive follow-up destination. Compared to 2020/21, the percentage in a positive follow-up destination increased across leavers from most ethnic groups, but not all. The percentage of White – non-Scottish leavers in a positive follow-up destination remained the same as in 2020/21, at 93.2 per cent. And the percentage in a positive follow-up destination decreased compared to 2020/21 among leavers from an African/ Black/ Caribbean ethnic background, and among those from 'Mixed or multiple ethnic groups'. When considering these changes it is important to be aware that the total numbers of leavers in some categories (in particular Asian – Chinese, Asian – Indian and 'All Other Categories') are relatively small, which can lead to the percentage in a positive destination fluctuating year-on-year.
In 2021/22, Remote Small Towns had the lowest proportion of leavers in positive destinations (92.3 per cent). Accessible Rural areas had the highest (95.1 per cent). Accessible Rural areas saw the biggest increase in leavers in a positive follow-up destination compared to 2020/21, and Remote Small Towns saw the biggest decrease.
School leavers in 2021/22 with an Additional Support Need (ASN) were less likely to be in a positive follow-up destination than leavers without a recorded ASN (90.1 per cent compared to 95.7 per cent). This is the same pattern as seen in previous years. However the percentage of leavers in a positive destination increased more between 2020/21 and 2021/22 for leavers with an ASN than for those without.
School leavers who are declared or assessed disabled were also less likely to be in a positive follow-up destination than leavers who are not (89.2 per cent compared to 93.6 per cent). The percentage of leavers who are declared or assessed disabled who were in a positive follow-up destination remained the same in 2020/21 and 2021/22 (89.2 per cent). The percentage of leavers who are not declared or assessed disabled increased from 93.4 per cent in 2020/21 to 93.6 per cent in 2021/22.
More information on destinations by pupil characteristics is available in the supplementary tables. A list of these tables is available in section 4.11.
| Pupil Characteristic | 2016/17 | 2017/18 | 2018/19 | 2019/20 | 2020/21 | 2021/22 |
|---|---|---|---|---|---|---|
| Sex | ||||||
| Male | 92.4 | 92.4 | 92.1 | 90.9 | 92.6 | 92.9 |
| Female | 94.0 | 94.3 | 93.7 | 93.6 | 93.8 | 94.0 |
| Ethnicity | ||||||
| White - Scottish | 93.0 | 93.2 | 92.7 | 92.0 | 93.1 | 93.4 |
| White - non-Scottish | 93.9 | 94.2 | 93.5 | 92.3 | 93.2 | 93.2 |
| Mixed or multiple ethnic groups | 92.7 | 93.6 | 92.8 | 91.7 | 94.7 | 93.9 |
| Asian - Indian | [c] | 97.2 | 94.4 | 95.4 | [c] | 98.5 |
| Asian - Pakistani | 95.7 | 93.5 | 94.8 | 95.6 | 95.5 | 96.5 |
| Asian - Chinese | [c] | 96.8 | [c] | [c] | [c] | 97.6 |
| Asian - Other | 95.3 | 93.9 | [c] | [c] | 95.5 | 96.4 |
| African/ Black/ Caribbean | 93.9 | 96.0 | 94.1 | 95.1 | 96.6 | 95.2 |
| All other categories | 94.5 | 92.0 | 93.6 | 93.3 | 92.6 | 92.7 |
| Not Disclosed/Not known | 90.7 | 89.8 | 88.9 | 90.2 | 91.6 | 92.7 |
| Urban/Rural | ||||||
| Large Urban Areas | 92.4 | 92.4 | 92.4 | 92.2 | 93.2 | 93.7 |
| Other Urban Areas | 92.4 | 92.9 | 92.1 | 91.4 | 92.3 | 92.7 |
| Accessible Small Towns | 93.3 | 93.7 | 93.7 | 93.0 | 93.8 | 93.7 |
| Remote Small Towns | 94.6 | 94.8 | 93.6 | 91.1 | 93.1 | 92.3 |
| Accessible Rural | 95.2 | 95.1 | 94.5 | 93.7 | 94.7 | 95.1 |
| Remote Rural | 96.4 | 95.9 | 94.6 | 93.8 | 95.4 | 94.8 |
| Additional Support Needs | ||||||
| ASN | 87.7 | 88.4 | 87.9 | 87.2 | 89.2 | 90.1 |
| No ASN | 95.0 | 95.3 | 95.1 | 94.9 | 95.5 | 95.7 |
| Disabled status | ||||||
| Declared or assessed disabled | 89.4 | 89.3 | 89.6 | 89.0 | 89.2 | 89.2 |
| Not declared or assessed disabled | 93.2 | 93.5 | 92.9 | 92.3 | 93.4 | 93.6 |
| All Leavers | 93.1 | 93.3 | 92.9 | 92.2 | 93.2 | 93.5 |
Note 13: Some categories have been grouped together due to small numbers. Some categories contain between 100-200 leavers and may be subject to fluctuation. Comparisons between groups should take this into account.
Note 14: The 'African/ Black/ Caribbean' category includes 'African', 'African - Other', and the 'Caribbean or Black' categories. 'All other categories' includes 'Other - other' and 'Other - Arab'.
Note 15: Additional Support Needs (ASN): pupils who have a Coordinated Support Plan (CSP), Individualised Education Programme (IEP), Child's Plan, are assessed or declared disabled, or have another need. See section 4.9 for more information.
Contact
Email: school.stats@gov.scot
There is a problem
Thanks for your feedback