Summary statistics for attainment and initial leaver destinations, no. 6: 2024 edition
This statistical publication provides information on the educational attainment and initial destinations of 2022-23 school leavers from publicly funded schools in Scotland.
This document is part of a collection
Section 4. School leaver attainment in National Qualifications
Section 4.1 Key points
- 84.8 per cent of school leavers left with one pass or more at SCQF Level 5 or better in National Qualifications in 2022-23. This is a decrease from 2021-22 (86.4 per cent).
- 57.9 per cent of school leavers left with one pass or more at SCQF Level 6 or better in National Qualifications in 2022-23. This is a decrease from 2021-22 (61.3 per cent).
- 2.2 per cent of school leavers attained no passes at SCQF Level 3 or better in National Qualifications in 2022-23. This is an increase from 2021-22 (2.1 per cent).
- The different approaches to determining results in 2020, 2021, 2022 and 2023 should be kept in mind when considering changes in school leaver attainment between years.
The statistics in Section 4 relate to attainment in the National Qualifications provided by SQA. These are National Courses (e.g. National 5, Higher, Advanced Higher) and Skills for Work. There is more information in section 1.4. They refer to all school leavers from mainstream schools, including S3, S4, S5, S6 and ‘other’ stages.
As described in section 1.6, the coronavirus pandemic (COVID-19) led to changes in how National Qualifications were assessed and graded in the years 2020 to 2023. This will have had an impact on the attainment of school leavers in 2019-20, 2020-21, 2021-22 and 2022-23. We have placed a dashed line break in the series between 2018-19 and 2019-20 to highlight where the change happened. Care must be taken when comparing attainment of school leavers in 2018-19 and before, with that of school leavers in 2019-20 and beyond. Any interpretation of changes must take full account of the different certification methods used in different years, and changes in the attainment levels in 2019-20, 2020-21, 2021-22 and 2022-23 should not be seen as an indication that performance has improved or worsened, without further evidence.
Section 4.2 School leaver attainment in National Qualifications
Table 4 shows the highest SCQF Level achieved by school leavers based on the National Qualifications measure. In 2022-23, 1.7 per cent of school leavers left with one pass or more in National Qualifications at SCQF Level 3 as their highest level, 11.2 per cent with one pass or more at SCQF Level 4 and 26.9 per cent left with one pass or more at SCQF Level 5. A total of 39.8 per cent of 2022-23 school leavers therefore left with one pass or more at SCQF Levels 3 to 5 as their highest qualification under the National Qualifications measure. This was an increase from 2021-22, when 36.7 per cent left with one pass or more at SCQF Levels 3 to 5 as their highest qualification.
Table 4 also shows that, based on the National Qualifications measure, 37.7 per cent of 2022-23 school leavers left with one pass or more at SCQF Level 6 as their highest level, and 20.2 per cent left with one pass or more at SCQF Level 7. These proportions have both decreased from 2021-22, when 39.8 per cent of leavers left with one pass or more at SCQF Level 6 as their highest level, and 21.5 per cent left with one pass or more at SCQF Level 7.
A small proportion (2.2 per cent) of school leavers attained no passes in National Qualifications at SCQF Level 3 or better in 2022-23. This has increased slightly as a proportion from 2021-22. Some of these school leavers have attainment either in courses at SCQF Levels 1 or 2, or in courses/units not covered in these statistics (such as National Progression Awards, National Certificates and Awards). Details can be found in supplementary tables N1.4a and N1.4b.
| SCQF Level | 2018-19 | 2019-20 | 2020-21 | 2021-22 | 2022-23 |
|---|---|---|---|---|---|
| No passes at SCQF 3 or better | 2.2 | 2.0 | 2.1 | 2.1 | 2.2 |
| SCQF Level 3 | 1.9 | 2.2 | 1.8 | 1.5 | 1.7 |
| SCQF Level 4 | 10.9 | 10.1 | 8.5 | 10.0 | 11.2 |
| SCQF Level 5 | 24.5 | 21.8 | 21.7 | 25.1 | 26.9 |
| SCQF Level 6 | 41.4 | 40.6 | 41.8 | 39.8 | 37.7 |
| SCQF Level 7 | 19.1 | 23.2 | 24.2 | 21.5 | 20.2 |
| Number of leavers | 49,760 | 47,454 | 50,746 | 55,237 | 54,743 |
Note 18: A dashed line break has been placed between the attainment figures for 2018-19 and 2019-20. This reflects the impact of the change to the assessment approach in 2020 and 2021 on attainment in years from 2019-20 onwards. Further information can be found in Sections 1.6, 4.1 and 8.7.
Table 5 provides information on the number of passes in National Qualifications achieved by school leavers at each SCQF Level or better. In 2022-23, 84.8 per cent of school leavers left with one pass or more at SCQF Level 5 or better, and 57.9 per cent left with one pass or more at SCQF Level 6 or better. These proportions have both decreased from 2021-22, when 86.4 per cent of school leavers left with one pass or more at SCQF Level 5 or better, and 61.3 per cent left with one pass or more at SCQF Level 6 or better.
In addition to the impact of alternative approaches to certification resulting from the coronavirus (COVID-19) pandemic, the change in the make-up of the school leaver cohort in 2022-23 compared to recent years may have had an effect on overall school leaver attainment. As described in section 2.2, 2022-23 saw a lower proportion of S6 school leavers and increased proportions of S4 and S5 leavers compared to recent years. Those leaving in earlier stages may be less likely to leave with qualifications at higher SCQF levels than those leaving in S6.
A time series from 2009-10 to 2022-23 is presented in Table 5 in the supplementary tables.
Table 5: Total leaver attainment under the National Qualifications measure, percentage of leavers, 2018-19 to 2022-23 [note 19] [note 20]
| SCQF Level | 1 pass or more | 2 passes or more | 3 passes or more | 4 passes or more | 5 passes or more | 6 passes or more | 7 passes or more |
|---|---|---|---|---|---|---|---|
| 3 or better | 97.8 | 96.1 | 93.6 | 90.8 | 86.6 | 78.9 | 66.6 |
| 4 or better | 96.0 | 93.4 | 90.6 | 87.3 | 82.7 | 75.7 | 63.8 |
| 5 or better | 84.8 | 77.0 | 70.0 | 63.2 | 56.0 | 48.5 | 39.6 |
| 6 or better | 57.9 | 48.7 | 41.9 | 35.5 | 28.4 | 18.5 | 9.0 |
| 7 | 20.2 | 8.8 | 3.3 | 0.3 | [low] | [low] | [low] |
| SCQF Level | 1 pass or more | 2 passes or more | 3 passes or more | 4 passes or more | 5 passes or more | 6 passes or more | 7 passes or more |
|---|---|---|---|---|---|---|---|
| 3 or better | 97.9 | 96.5 | 94.5 | 92.1 | 88.3 | 81.2 | 68.9 |
| 4 or better | 96.4 | 94.1 | 91.7 | 88.8 | 84.4 | 77.7 | 65.6 |
| 5 or better | 86.4 | 79.5 | 73.0 | 66.4 | 59.2 | 51.6 | 42.6 |
| 6 or better | 61.3 | 52.4 | 45.7 | 38.6 | 30.7 | 19.9 | 9.9 |
| 7 | 21.5 | 9.5 | 3.3 | 0.4 | [low] | [low] | 0.0 |
| SCQF Level | 1pass or more | 2 passes or more | 3 passes or more | 4 passes or more | 5 passes or more | 6 passes or more | 7 passes or more |
|---|---|---|---|---|---|---|---|
| 3 or better | 97.9 | 96.5 | 94.6 | 92.4 | 89.1 | 82.9 | 70.6 |
| 4 or better | 96.2 | 93.9 | 91.8 | 89.2 | 85.5 | 79.3 | 67.6 |
| 5 or better | 87.7 | 81.9 | 76.3 | 69.9 | 62.6 | 54.1 | 43.6 |
| 6 or better | 66.0 | 57.7 | 50.5 | 43.4 | 35.3 | 23.6 | 12.2 |
| 7 | 24.2 | 11.0 | 3.7 | 0.4 | [low] | 0.0 | 0.0 |
| SCQF Level | 1 pass or more | 2 passes or more | 3 passes or more | 4 passes or more | 5 passes or more | 6 passes or more | 7 passes or more |
|---|---|---|---|---|---|---|---|
| 3 or better | 98.0 | 96.3 | 94.1 | 91.8 | 88.1 | 81.2 | 67.9 |
| 4 or better | 95.8 | 93.3 | 90.9 | 88.1 | 84.1 | 77.6 | 64.9 |
| 5 or better | 85.7 | 79.2 | 73.0 | 66.4 | 59.2 | 51.0 | 40.5 |
| 6 or better | 63.9 | 55.2 | 47.9 | 40.9 | 32.9 | 21.5 | 10.7 |
| 7 | 23.2 | 10.4 | 3.5 | 0.3 | [c] | [c] | 0.0 |
| SCQF Level | 1 pass or more | 2 passes or more | 3 passes or more | 4 passes or more | 5 passes or more | 6 passes or more | 7 passes or more |
|---|---|---|---|---|---|---|---|
| 3 or better | 97.8 | 96.1 | 94.0 | 91.6 | 87.7 | 80.5 | 66.3 |
| 4 or better | 95.9 | 93.6 | 91.2 | 88.2 | 84.0 | 77.1 | 63.5 |
| 5 or better | 85.1 | 77.6 | 70.5 | 63.4 | 55.8 | 47.8 | 37.6 |
| 6 or better | 60.5 | 50.6 | 43.0 | 36.1 | 28.7 | 18.5 | 8.9 |
| 7 | 19.1 | 8.0 | 2.7 | 0.3 | [c] | [c] | 0.0 |
Note 19: A dashed line break has been placed between the attainment figures for 2018-19 and 2019-20. This reflects the impact of the change to the assessment approach in 2020 and 2021 on attainment in years from 2019-20 onwards. Further information can be found in Sections 1.6, 4.1 and 8.7.
Note 20: [c] = value suppressed to protect against the risk of disclosure of personal information. [low] = value less than 0.05% but greater than zero. See Section 7 for a full list of symbols used in the tables.
Section 4.3 School leaver attainment in National Qualifications, by deprivation
As outlined in section 3.3, the National Improvement Framework monitors the poverty-related attainment gap based on a basket of key measures. Three of these measures are based on school leaver attainment by deprivation, namely:
- The proportion of leavers attaining one pass or more in National Qualifications at SCQF Level 4 or better
- The proportion of leavers attaining one pass or more in National Qualifications at SCQF Level 5 or better
- The proportion of leavers attaining one pass or more in National Qualifications at SCQF Level 6 or better
As described in Sections 1.6 and 4.1, there were changes in the way in which many qualifications were assessed and graded in the years 2020 to 2023, as a result of the COVID-19 pandemic. Therefore care should be taken when making comparisons between 2022-23 and earlier years. Any increase or decrease should not be interpreted as indicating improving or worsening performance without further evidence.
Chart 4 shows the proportions of school leavers from the most and least deprived areas who attained one pass or more in National Qualifications at SCQF Levels 4 or better, 5 or better and 6 or better. As described in Sections 1.6 and 4.1, care should be taken when making comparisons between 2022-23 and earlier years. Any increase or decrease should not be interpreted as indicating improving or worsening performance without further evidence.
At SCQF Level 4 or better, the gap between the proportion of school leavers from the most deprived and least deprived areas attaining 1 pass or more in National Qualifications was 5.9 percentage points. This is slightly wider than in 2021-22, when it was 5.8 percentage points. The proportion attaining 1 pass or more in National Qualifications at this level decreased for school leavers from both the most and the least deprived areas between 2021-22 and 2022-23. But it decreased by slightly more for those from the most deprived areas, which has led to the gap between the two groups widening.
Longer term, the gap at SCQF Level 4 or better has narrowed most years, starting from 11.3 percentage points in 2009-10 and reaching its narrowest in 2021-22 (5.8 percentage points). A full time series for attainment at SCQF Level 4 or better, SCQF Level 5 or better and SCQF Level 6 or better since 2009-10 under the National Qualifications measure is available in the supplementary tables.
At SCQF Level 5 or better, the gap was 20.2 percentage points in 2022-23. This is wider than in 2021-22 (19.1 percentage points). The proportion attaining 1 pass or more in National Qualifications at this level decreased for school leavers from both the most and the least deprived areas between 2021-22 and 2022-23. But it decreased by slightly more for those from the most deprived areas, which has led to the gap between the two groups widening.
Longer term, the gap has narrowed most years, starting from 33.3 percentage points in 2009-10 and reaching its narrowest in 2020-21 (18.2 percentage points).
At SCQF Level 6 or better, the gap was 36.9 percentage points in 2022-23. This is slightly narrower than in 2021-22 (37.0 percentage points). The proportion attaining 1 pass or more in National Qualifications decreased for school leavers from both the most and the least deprived areas between 2021-22 and 2022-23. But it decreased by more for those from the least deprived areas, which has led to the gap between the two groups narrowing.
Longer term, the gap has narrowed most years, starting from 45.6 percentage points in 2009-10 and reaching its narrowest in 2020-21 (34.4 percentage points).
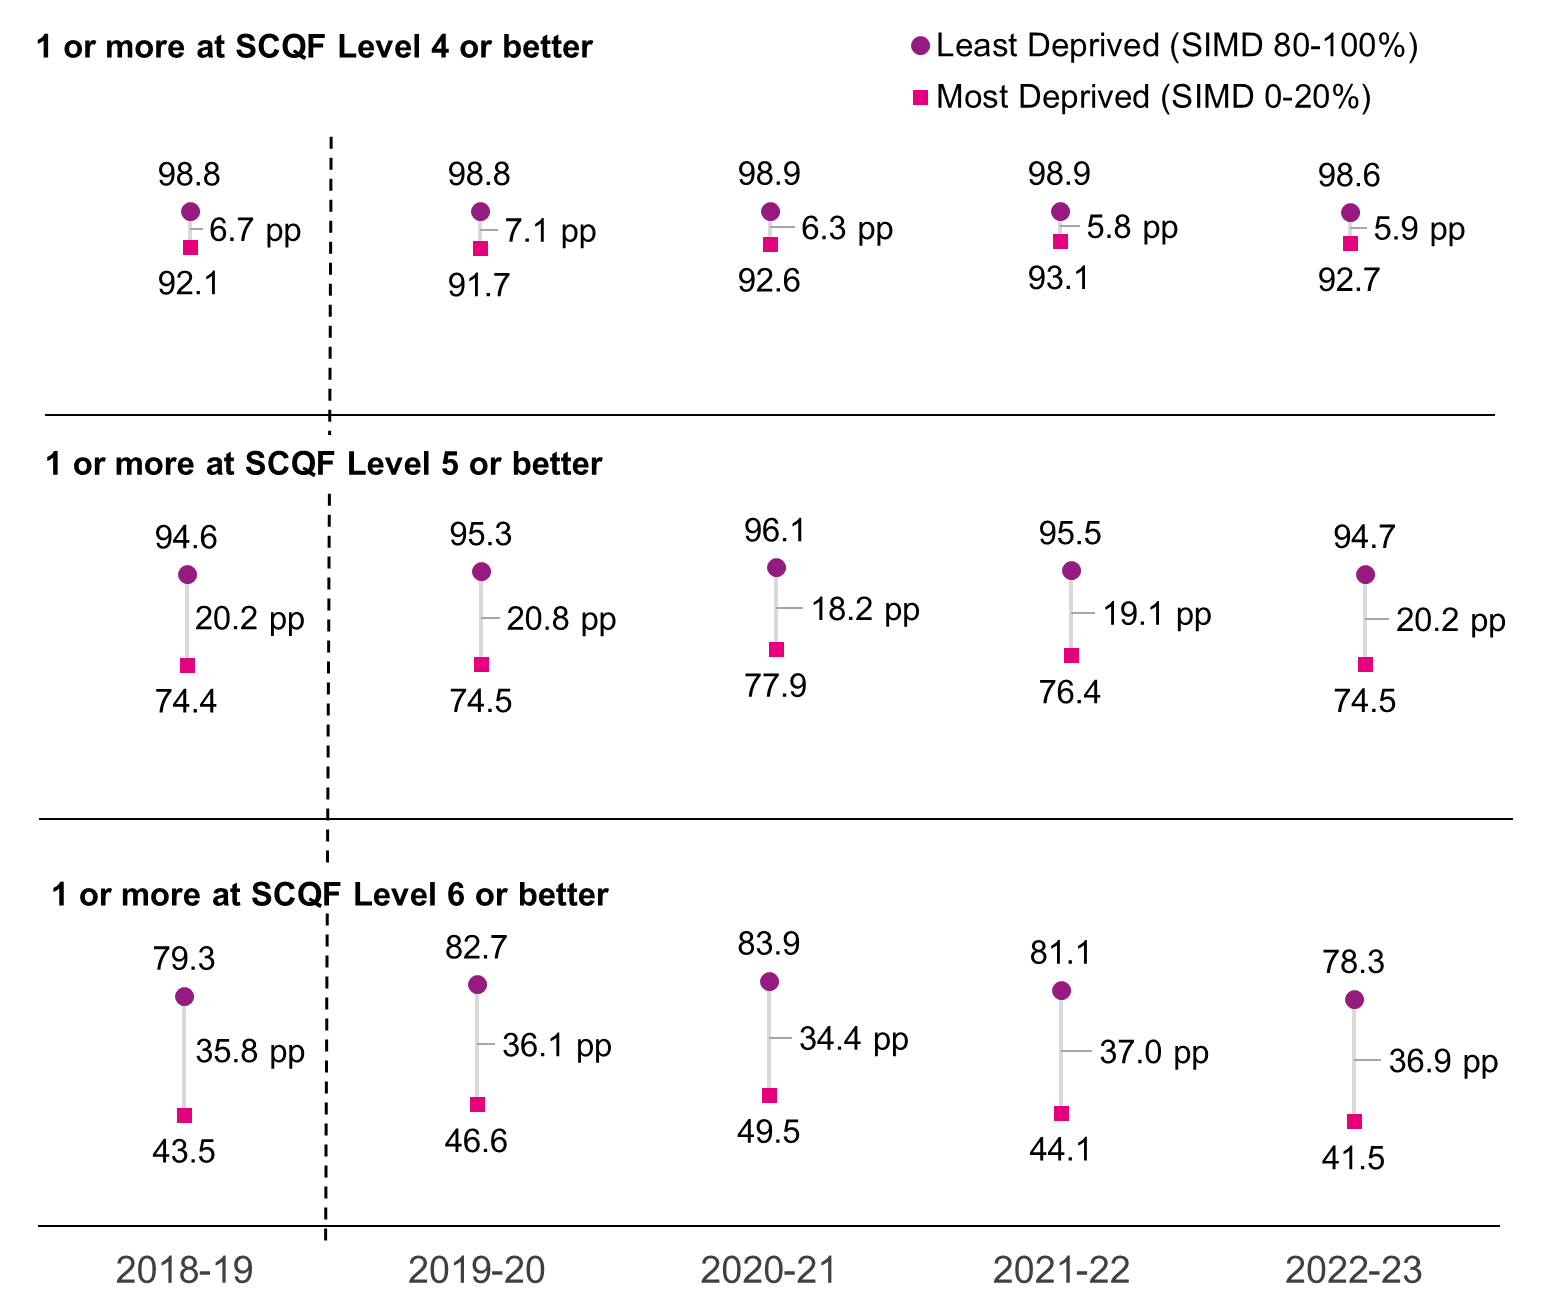
Note 21: pp = percentage point difference between most and least deprived quintile.
Note 22: Based on the Scottish Index of Multiple Deprivation (SIMD) 2009 for 2009-10 and 2010-11, SIMD 2012 for 2011-12 to 2015-16, SIMD 2016 for 2016-17 to 2019-20, and SIMD 2020 for 2020-21, 2021-22 and 2022-23. More information on the Scottish Index of Multiple Deprivation.
Note 23: A dashed line break has been placed between the attainment figures for 2018-19 and 2019-20. This reflects the impact of the change to the assessment approach in 2020 and 2021 on attainment in years from 2019-20 onwards. Further information can be found in Sections 1.6, 4.1 and 8.7.
Section 4.4 School leaver attainment in National Qualifications, by pupil characteristic
Table 6 shows school leaver attainment by pupil characteristic, such as sex and ethnicity. It shows that female pupils are continuing to outperform male pupils in National Qualifications at SCQF Levels 4 to 6 or better, with the gap being wider at higher SCQF levels.
Asian-Chinese pupils continue to have high levels of attainment compared to other groups, with 91.3 per cent achieving one pass or more in a National Qualification at SCQF Level 6 or better.
Pupils with a recorded Additional Support Need (ASN) are less likely to achieve National Qualifications at SCQF Levels 4 to 6 or better than pupils without an ASN. Similarly, pupils who are declared or assessed disabled are less likely to achieve SCQF Levels 4 to 6 or better than pupils who are not. In both cases, the gap is wider at higher SCQF levels.
In 2022-23 pupils living in Accessible Rural areas and Remote Rural areas are the most likely to achieve National Qualifications at SCQF Level 4 or better. Those living in Accessible Rural and Remote Rural areas are most likely to achieve at SCQF Level 5 or better. And at SCQF level 6 or better pupils living in Accessible Rural and Large Urban areas have the highest levels of attainment. Pupils living in Remote Small Towns are the least likely to achieve at SCQF levels 4 to 6 or better.
Broad patterns in attainment by pupil characteristic are typically stable year on year, although small numbers in some characteristic groups mean fluctuations do occur. Table 6 shows that a lower percentage of 2022-23 school leavers achieved one pass or more in National Qualifications at all SCQF Levels than in 2021-22, across almost all characteristic breakdowns.
| 2021-22 | 2022-23 | |||||
|---|---|---|---|---|---|---|
| Pupil Characteristic | 1 or more at SCQF Level 4 or better | 1 or more at SCQF Level 5 or better | 1 or more at SCQF Level 6 or better | 1 or more at SCQF Level 4 or better | 1 or more at SCQF Level 5 or better | 1 or more at SCQF Level 6 or better |
| Sex | ||||||
| Male | 96.0 | 85.5 | 56.9 | 95.7 | 83.8 | 53.4 |
| Female | 96.8 | 87.4 | 65.8 | 96.4 | 85.8 | 62.7 |
| Ethnicity | ||||||
| White – Scottish | 96.3 | 85.9 | 60.0 | 96.0 | 84.3 | 56.4 |
| White – non-Scottish | 96.5 | 86.4 | 62.0 | 95.5 | 84.1 | 57.9 |
| Mixed or multiple ethnic groups | 97.0 | 91.0 | 71.0 | 96.4 | 89.3 | 71.1 |
| Asian – Indian | [c] | [c] | 83.6 | [c] | 94.9 | 83.3 |
| Asian – Pakistani | 98.7 | 93.3 | 76.6 | 98.6 | 92.4 | 74.5 |
| Asian – Chinese | [c] | [c] | 93.6 | [c] | 98.0 | 91.3 |
| Asian – Other | 98.2 | 93.6 | 76.2 | [c] | 90.8 | 77.6 |
| African/ Black/ Caribbean | 98.8 | 95.1 | 78.1 | 98.1 | 93.2 | 74.2 |
| All other categories | 96.1 | 85.6 | 63.7 | 93.2 | 83.7 | 58.9 |
| Not Disclosed/Not known | 94.9 | 82.9 | 55.9 | 92.8 | 81.3 | 57.0 |
| Urban/Rural | ||||||
| Large Urban Areas | 96.1 | 86.0 | 63.0 | 95.7 | 85.0 | 60.5 |
| Other Urban Areas | 96.3 | 85.4 | 59.3 | 95.8 | 83.0 | 55.1 |
| Accessible Small Towns | 96.9 | 87.6 | 62.5 | 96.1 | 85.6 | 57.9 |
| Remote Small Towns | 95.8 | 84.2 | 55.8 | 95.3 | 81.7 | 48.1 |
| Accessible Rural | 97.2 | 89.1 | 63.8 | 97.4 | 87.7 | 60.7 |
| Remote Rural | 96.8 | 89.3 | 62.6 | 96.6 | 88.1 | 58.9 |
| Additional Support Needs | ||||||
| ASN | 93.0 | 75.0 | 42.9 | 92.5 | 73.3 | 40.9 |
| No ASN | 98.6 | 93.8 | 73.3 | 98.5 | 93.0 | 70.1 |
| Disabled status | ||||||
| Declared or assessed disabled | 87.3 | 66.1 | 34.5 | 86.0 | 66.0 | 34.6 |
| Not declared or assessed disabled | 96.7 | 87.1 | 62.2 | 96.4 | 85.4 | 58.7 |
| All Leavers | 96.4 | 86.4 | 61.3 | 96.0 | 84.8 | 57.9 |
Note 24: Some categories have been grouped together due to small numbers. Some categories (typically ‘Asian – Indian’ and ‘Asian – Chinese’) contain between 100-200 leavers and due to relatively small numbers may be subject to fluctuation. Comparisons between groups should take this into account.
Note 25: The ‘African/Black/Caribbean’ category includes ‘African’, ‘African – Other’ and ‘Caribbean or Black’ categories
Note 26: ‘All other categories’ includes ‘Other – other’ and ‘Other – Arab’.
Note 27: Pupils who have a Coordinated Support Plan (CSP), Individualised Educational Programme (IEP) or Child’s Plan are assessed or declared disabled or have another need.
Note 28: [c] = value suppressed to protect against the risk of disclosure of personal information. (See Section 7 for a full list of symbols used in the tables.)
Section 4.5 School leaver destinations and attainment in National Qualifications
Table 7 shows that for 2022-23, the majority of school leavers with one pass or more in a National Qualification at SCQF Level 6 or Level 7 entered Higher Education (56.8 per cent and 88.0 per cent respectively). For all other leavers, the most common destination was Further Education. For example, 49.4 per cent of leavers whose highest National Qualification was at SCQF Level 5 entered Further Education. This compares to 46.4 per cent of those whose highest qualification was at SCQF Level 4 and 36.0 per cent of those whose highest qualification was at SCQF Level 3. Amongst those with no passes at SCQF Level 3, 25.3 per cent entered Further Education.
Leavers with no passes at SCQF Level 3 or better were the most likely to be in Other Destinations (26.6 per cent), and leavers with one pass or more at SCQF Level 7 were the least likely to be in Other Destinations (0.7 per cent).
| Initial Destination | No passes at SCQF 3 or better | SCQF Level 3 | SCQF Level 4 | SCQF Level 5 | SCQF Level 6 | SCQF Level 7 | Total |
|---|---|---|---|---|---|---|---|
| Higher Education | 1.9 | 0.0 | 0.6 | 3.7 | 56.8 | 88.0 | 40.3 |
| Further Education | 25.3 | 36.0 | 46.4 | 49.4 | 16.8 | 3.0 | 26.6 |
| Training | 17.3 | 19.0 | 11.2 | 4.0 | 0.7 | 0.2 | 3.4 |
| Employment | 21.5 | 17.7 | 27.3 | 37.4 | 23.7 | 7.5 | 24.3 |
| Voluntary Work | 1.0 | 1.8 | 0.8 | 0.5 | 0.4 | 0.6 | 0.5 |
| Personal Skills Development | 6.4 | 4.6 | 2.4 | 0.6 | 0.2 | 0.1 | 0.7 |
| Positive Destinations | 73.4 | 79.1 | 88.7 | 95.6 | 98.4 | 99.3 | 95.9 |
| Unemployed Seeking | 8.4 | 10.1 | 6.2 | 2.8 | 1.0 | 0.4 | 2.2 |
| Unemployed Not Seeking | 15.2 | 10.0 | 4.4 | 1.2 | 0.5 | 0.3 | 1.6 |
| Unknown | 3.0 | 0.7 | 0.6 | 0.4 | 0.1 | 0.1 | 0.3 |
| Other Destinations | 26.6 | 20.9 | 11.3 | 4.4 | 1.6 | 0.7 | 4.1 |
| Number of Leavers | 1,220 | 948 | 6,158 | 14,704 | 20,658 | 11,055 | 54,743 |
Note 29: Percentages may not total 100 due to rounding
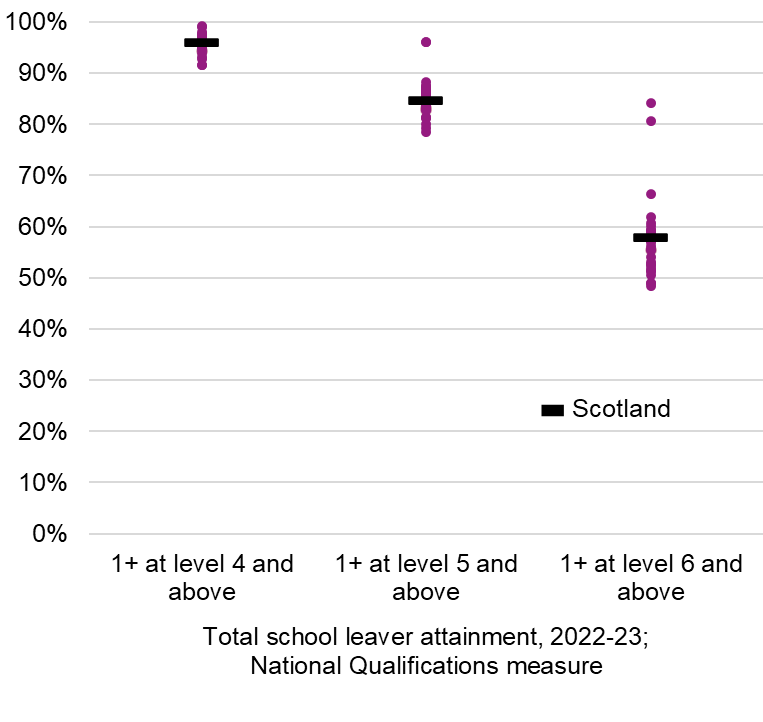
Section 4.6 School leaver attainment in National Qualifications, by local authority
This chapter describes the range of attainment in National Qualifications by school leavers in the 32 local authorities, and compares it to the national level results.
A range of factors will affect attainment at local authority level including presentation policies and the context of each authority. Factors such as levels of poverty or deprivation, the stage at which pupils leave school and the structure of the local economy (for example, the relative levels of post school opportunities in the employment sector or the continuing education sectors) may have an impact on the levels of attainment which pupils leave school with. This should be kept in mind when making comparisons between local authorities.
Table 8 shows the percentage of leavers in each local authority – and for Scotland – who attained one pass or more at SCQF Level 4 or better, SCQF Level 5 or better and SCQF Level 6 or better, in 2022-23. Note that some figures at local authority level have been suppressed due to the small numbers of school leavers involved.
In 2022-23, for one pass or more at SCQF Level 4 and above, attainment in the local authorities under the National Qualifications measure ranges from 91.6 per cent to 99.2 per cent, a range of 7.6 percentage points. For one pass or more SCQF Level 5 or better, National Qualifications attainment ranges from 78.6 per cent to 96.2 per cent, a range of 17.6 percentage points. For one pass or more at SCQF Level 6 or better, National Qualifications attainment ranges from 48.5 per cent to 84.2 per cent, a range of 35.7 percentage points.
| Local Authority | 1+ at SCQF Level 4 or better | 1+ at SCQF Level 5 or better | 1+ at SCQF Level 6 or better |
|---|---|---|---|
| Aberdeen City | 95.9 | 83.3 | 55.5 |
| Aberdeenshire | 96.3 | 87.6 | 57.4 |
| Angus | 94.4 | 82.9 | 52.6 |
| Argyll & Bute | 95.4 | 86.2 | 57.0 |
| Clackmannanshire | 91.6 | 81.3 | 49.0 |
| Dumfries & Galloway | 95.7 | 85.9 | 53.6 |
| Dundee City | 92.9 | 80.0 | 51.4 |
| East Ayrshire | 96.7 | 83.3 | 53.1 |
| East Dunbartonshire | 99.2 | 96.0 | 80.6 |
| East Lothian | 95.4 | 78.6 | 55.4 |
| East Renfrewshire | 99.1 | 96.2 | 84.2 |
| Edinburgh, City of | 96.2 | 83.9 | 62.0 |
| Falkirk | 98.0 | 85.5 | 58.9 |
| Fife | 95.7 | 79.3 | 50.6 |
| Glasgow City | 94.6 | 83.9 | 58.6 |
| Highland | 95.8 | 85.1 | 55.7 |
| Inverclyde | 97.4 | 86.7 | 60.2 |
| Midlothian | 97.8 | 82.8 | 48.5 |
| Moray | 96.3 | 83.7 | 51.9 |
| Na h-Eileanan Siar | 94.0 | 85.2 | 51.3 |
| North Ayrshire | 96.2 | 82.9 | 54.0 |
| North Lanarkshire | 95.0 | 83.3 | 56.3 |
| Orkney Islands | 95.4 | 87.6 | [c] |
| Perth & Kinross | 96.7 | 86.1 | 59.4 |
| Renfrewshire | 97.2 | 88.2 | 59.4 |
| Scottish Borders | 95.4 | 82.8 | 57.4 |
| Shetland Islands | 97.2 | 87.0 | 55.4 |
| South Ayrshire | 96.3 | 86.6 | 57.8 |
| South Lanarkshire | 97.3 | 87.1 | 60.7 |
| Stirling | 96.9 | 86.2 | 66.5 |
| West Dunbartonshire | 93.1 | 81.5 | 52.6 |
| West Lothian | 97.0 | 85.6 | 57.2 |
| Scotland | 96.0 | 84.8 | 57.9 |
Note 30: [c] value suppressed to protect against the risk of disclosure of personal information
Note 31: keep in mind the context of each local authority if making comparisons between them.
Chart 5 also illustrates the range in attainment under the National Qualifications measure between the local authorities for which data can be presented. It shows that the range in attainment increases as the SCQF level considered increases.
Note 32: keep in mind the context of each local authority if making comparisons between them.
Further data on attainment by local authority for years 2009-10 to 2022-23 are provided in the supplementary tables. The supplementary tables also include a breakdown of attainment in National Qualifications in each local authority by deprivation.
Contact
Email: school.stats@gov.scot
There is a problem
Thanks for your feedback