Statistical Bulletin: Crime and Justice Series: Criminal Justice Social Work Statistics, 2010-11
Criminal Justice Social Work Statistics
4 Social work orders
(Tables 1 to 4&10 to 24,Charts 3 to 7)
4.1 In this bulletin, the term "social work orders" is used to refer to the four order types Community Service, Probation, Supervised Attendance and Drug Treatment & Testing.
4.2 The total number of social work orders (excluding Community Payback Orders) commenced in 2010-11 was 18,000. This represented a drop of 9 per cent on the previous year and of 13 per cent since 2008-09. Numbers are now at approximately the same level as they were in 2006-07. This shows a very similar trend to the number of people with a charge proved in Scottish courts who received a community sentence as their main penalty, as illustrated in the Criminal Proceedings in Scotland 2010-11 bulletin published on 13 December 2011. It is also interesting to note that the decrease over the last two years in social work order numbers is set against a backdrop of falling levels of recorded crime over the same period.
4.3 Total breach applications of social work orders (excluding Community Payback Orders) in 2010-11 was 7,900, a fall of 4 per cent on 2009-10 and 7 per cent lower than in 2008-09.
4.4 The number of terminations of social work orders (excluding Community Payback Orders) in 2010-11 was 17,700, 2 per cent lower than in 2009-10. Successful completions remained at the same level (11,300) while other terminations fell by 6 per cent to 6,300. As a result, 64 per cent of terminations in 2010-11 were for successful completions, the highest level in the period since data was first collected for all four order types in 2003-04.
I. Community Service Orders ( CSOs)
(Tables 1 to 5&10 to 11,Chart 3)
CSOs excluding Probation Orders with a Requirement of Unpaid Work
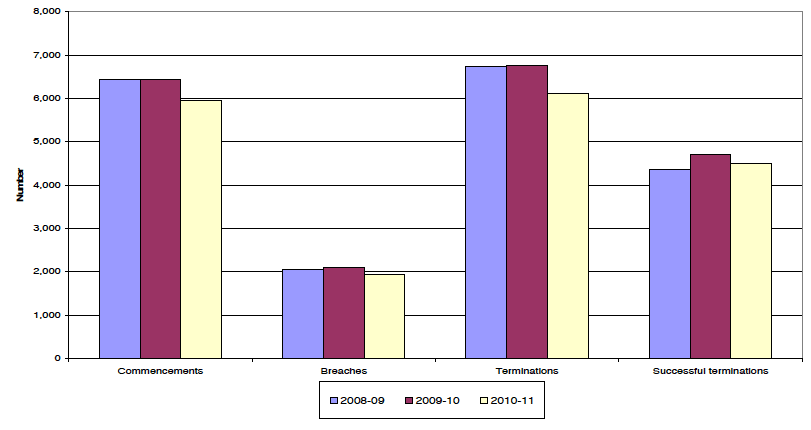
4.5 A total of 5,940 CSOs (excluding Probation Orders with a Requirement of Unpaid Work) were made in 2010-11 ( Table 1). This was an 8 per cent decrease on the 2009-10 total of 6,430 and brought numbers back to around the same level as 2006-07.
4.6 The fall at Scotland level in the number of CSOs is the net result of a number of varying changes at local authority level, with most showing decreases and a few showing increases. Further information is provided in the extra datasets on CSOs at CJA/ LA level which accompany this publication.
4.7 Male offenders accounted for 86 per cent of CSOs as shown in Table 2.
4.8 Females receiving CSOs tended to be older, with 68 per cent of such orders relating to over 25 year olds. The corresponding proportion for males was 53 per cent. CSOs were relatively more common amongst young offenders, with 49 and 40 orders per 10,000 population for 18-20 and 21-25 year olds respectively ( Table 2).
4.9 The employment status of offenders provides an indication of whether the offender is likely to be available for work during normal working hours ( i.e. weekdays between 9am and 5pm). Sixty per cent of CSOs were given to offenders who were either unemployed or not seeking employment. Thirty-six per cent were employed or self employed, in full time education or on a government sponsored training scheme ( Table 3).
4.10 Where information on ethnicity was known and was provided, 95 per cent of CSOs in 2010-11 related to offenders who were white ( Table 4).
4.11 The average length of a CSO in 2010-11 was 150 hours, an increase of around 5 hours from 145 in 2008-09 ( Table 5). This increase was even more marked among males with the average length of a CSO given to males increasing by 6 hours to 151 over the same period. The average for females in 2010-11 was 143, around the same as in 2008-09 and lower than the average of 145 days in 2009-10.
Breach Applications of CSOs
4.12 There were 1,930 breach applications made to the Courts in 2010-11 in respect of CSOs. This represented a decrease of 8 per cent compared with the 2,100 breach applications in 2009-10 ( Table 1 and Chart 3).
4.13 The number of breach applications is not directly comparable with the number of orders provided in paragraph 4.5 (which covers new orders only) as some of the breach applications may relate to orders started in the previous year. However, in 2009-10 there was a requirement that CSOs had to be completed within a 12 month period, and the number of orders started in 2010-11 (5,940 excluding Probation with Unpaid Work) can be taken as a proxy measure for the number of orders active during the year. This suggests that around a third of orders resulted in a breach application.
4.14 Around 15 per cent of breach applications resulted in the original order being revoked and a custodial sentence imposed, which is similar to 2009-10 ( Table 10). A further 19 per cent of breaches resulted in the original order being revoked and some other action taken (including probation and monetary penalty). In 16 per cent of applications, the original order was continued and no further action taken by the court and in 7 per cent of applications, a warrant for apprehension/recall was made. The outcome was not yet known for 21 per cent of breach applications made in 2010-11, an increase from 18 per cent in 2009-10.
Chart 3 Commencements, breaches and terminations of CSOs, 2008-09 to 2010-11
Notes relating to Chart 3:
1. Excludes Probation Orders with a Requirement of Unpaid Work.
4.15 Males accounted for 89 per cent of breach applications in 2010-11. As males also accounted for a similar proportion of all new orders (see paragraph 4.7), this suggests breach applications are as likely to occur for men as for women.
4.16 An outcome of revoked and custody was more common amongst males (16 per cent) than females (10 per cent) as shown in Table 10.
Terminations of Community Service Orders
4.17 A total of 6,100 CSOs were terminated in 2010-11, a 10 per cent decrease from 2009-10 ( Table 1 and Chart 3). Approximately 74 per cent (4,500) of these orders were successfully completed ( Table 11), an increase from 70 per cent (4,700 out of 6,800) in 2009-10. In 2010-11, a further 3 per cent were revoked following a review, 15 per cent were revoked following a breach application to the courts and the remaining 8 per cent were terminated for other reasons (including transfer to another area or death of the offender).
4.18 Females (76 per cent) were slightly more likely to complete their orders successfully than males (73 per cent).
II. Probation Orders ( POs)
(Tables 1 to 5&12 to 14,Chart 4)
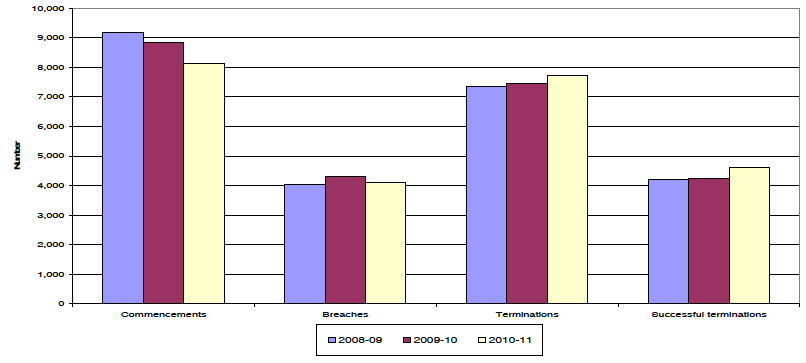
4.19 A total of 8,100 POs (including POs with a Requirement of Unpaid Work) were made in 2010-11 ( Table 1). This was a decrease of 8 per cent compared to the level of orders in 2009-10 and was the lowest total since 2003-04.
4.20 The fall at Scotland level in the number of POs is the net result of a number of varying changes at local authority level, with most showing decreases and a few showing increases. Further information is provided in the extra datasets on POs at CJA/ LA level which accompany this publication.
4.21 Male offenders accounted for 82 per cent of POs as shown in Table 2.
4.22 The incidence of POs was highest amongst 18 to 20 year olds in 2010-11 (67 per 10,000 population) and was also relatively common amongst 16 to 17 and 21 to 25 year olds (60 and 46 per 10,000 population, respectively).
4.23 Males receiving Probation tended to be younger than females, with 28 per cent of POs for males and 20 per cent for females being given to offenders aged under 21 years.
4.24 As with Community Service, the employment status of offenders provides an indication of the availability of offenders (see paragraph 4.9). Seventy-four per cent of POs were for offenders who were unemployed or not seeking employment. A further 23 per cent of POs were for offenders in full-time employment, self employed, in full time education or on a government sponsored training scheme ( Table 3).
4.25 When information on ethnicity could be provided, 97 per cent of POs in 2010-11 related to offenders in the white ethnic group ( Table 4).
4.26 The average length of a PO (excluding POs with a Requirement of Unpaid Work) in 2010-11 was 16.5 months, around the same as in the previous two years ( Table 5). The average length of a PO given to males in 2010-11, at 16.6 months, was slightly higher than the average for females of 15.8 months.
4.27 Around 32 per cent of all POs had standard conditions only ( Table 12). A Requirement of Unpaid Work was made in 30 per cent of orders, while 17 per cent included conditions of Alcohol or Drug Treatment/Education. POs with a condition of attendance on a domestic abuse programme remained at 3 per cent between 2009-10 and 2010-11. The number of POs with a condition of attendance on a sex offender programme saw a small increase (121 cases in 2010-11 compared with 92 in 2009-10).
4.28 Probation Orders with standard conditions only were more likely to be imposed on females (43 per cent) than males (30 per cent). A Requirement of Unpaid Work was more common amongst males (32 per cent) than females (21 per cent).
Breach Applications of POs
4.29 There were 4,100 breach applications made to the Courts in 2010-11 in respect of POs, a decrease of 4 per cent on 2009-10 ( Table 1 and Chart 4). Males accounted for 83 per cent of breach applications ( Table 13).
4.30 The number of breach applications is not directly comparable with the number of orders provided in paragraph 4.19 (which covers new orders only) as some of the breach applications may relate to orders started in previous years.
4.31 Around 17 per cent of breach applications resulted in the original order being revoked and a custodial sentence imposed, 13 per cent resulted in revocation and a new probation order, 2 per cent in revocation and a community service order and 8 per cent in revocation and some other action taken (including a monetary penalty). In 19 per cent of applications, the original order was continued and no further action taken by the court. The outcome was not yet known in 20 per cent of applications.
Terminations of POs
4.32 A total of 7,700 POs were terminated in 2010-11, an increase of 4 per cent from the 2009-10 total ( Table 1 and Chart 4). Sixty per cent of these orders (4,600) were successfully completed (including early discharge following a review) in 2010-11, compared with 57 per cent (4,200 out of 7,400) in 2009-10 ( Table 14). In 2010-11, 24 per cent were terminated following a breach application while the remaining 17 per cent were terminated for other reasons (including transfer to another area or death of the offender).
4.33 Females (62 per cent) were slightly more likely to complete orders successfully than males (59 per cent). A similar proportion of orders were terminated following a breach for males and females (11 and 12 per cent respectively).
Chart 4 Commencements, breaches and terminations of POs, 2008-09 to 2010-11
Notes relating to Chart 4:
1. Includes Probation Orders with a Requirement of Unpaid Work.
III. Probation Orders ( POs) with a Requirement of Unpaid Work (Tables 1&15 to 17,Chart 5)
4.34 These orders represent a subset of the data on all Probation Orders. A total of 3,000 POs with a Requirement of Unpaid Work were made in 2010-11 ( Table 1). This represented a decrease of 6 per cent from the 2009-10 total of 3,200 orders. Numbers have fallen in each of the last two years and the total for 2010-11 is now similar to levels in 2007-08.
4.35 The decrease in the number of POs with a requirement of unpaid work, is the net result of a number of varying changes at local authority level, with most showing decreases and a few showing increases. Further information is provided in the extra datasets on POs with a requirement of unpaid work at CJA/ LA level which accompany this publication.
4.36 The average length of a PO with a Requirement of Unpaid Work in 2010-11 was 139 hours ( Table 5). The average length of a PO given to males, at 140 hours, was substantially higher than for females (131 hours).
4.37 Male offenders accounted for 88 per cent of Probation Orders with a Requirement of Unpaid Work ( Table 15). For all persons, the incidence of POs was highest amongst 18 to 20 year olds (29 per 10,000 population) and was also relatively high amongst 16 to 17 and 21 to 25 year olds (17 and 20 per 10,000 population, respectively).
4.38 Males receiving these orders tended to be younger than females. Twenty-eight per cent of males were aged 20 or under, compared to 24 per cent of females.
4.39 As discussed in paragraphs 4.9 and 4.24, the employment status of offenders provides an indication of their availability to undertake unpaid work. Seventy-two per cent of POs with a Requirement of Unpaid Work were for offenders who were unemployed or not seeking employment ( Table 16). This proportion was higher for females (83 per cent) than males (70 per cent).
Breach Applications of POs with a Requirement of Unpaid Work
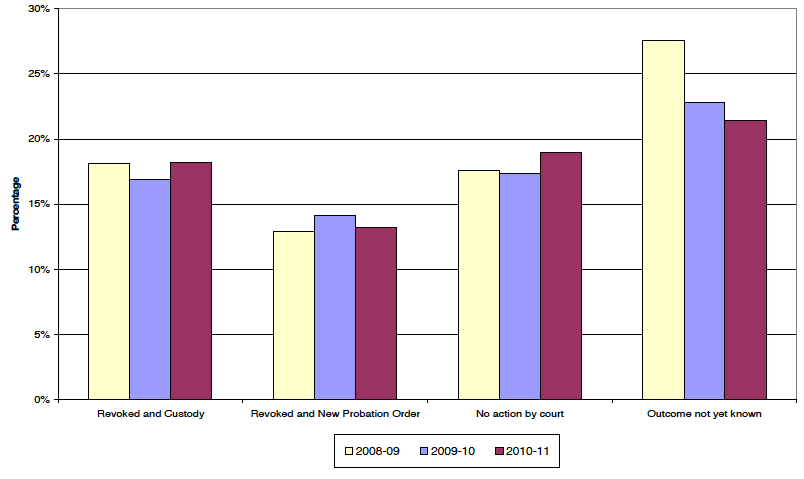
4.40 There were around 1,650 breach applications made to the Courts in 2010-11 in respect of POs with a Requirement of Unpaid Work, a decrease of 6 per cent compared to the 2009-10 total of 1,800 applications ( Table 1). In 2010-11, the condition of unpaid work was breached in 651 (39 per cent) of these cases ( Table 17). The outcome of breach applications has varied slightly between 2008-09 and 2010-11 ( Chart 5).
4.41 Males accounted for 87 per cent of all breach applications ( Table 17).
4.42 Eighteen per cent of all breach applications resulted in the original order being revoked and custody being imposed, while 13 per cent resulted in revocation and a new probation order. For a further 3 per cent, the order was revoked and a community service order imposed and 6 per cent resulted in revocation with some other action taken (including a monetary penalty). In 19 per cent of applications, the original order was continued and no further action taken by the court. The outcome was not yet known in 21 per cent of applications.
Chart 5 Breach Outcomes for POs (Unpaid Work), 2008-09 to 2010-11
IV. Supervised Attendance Orders ( SAOs)
(Tables 1 to 5&18 to 21,Chart 6)
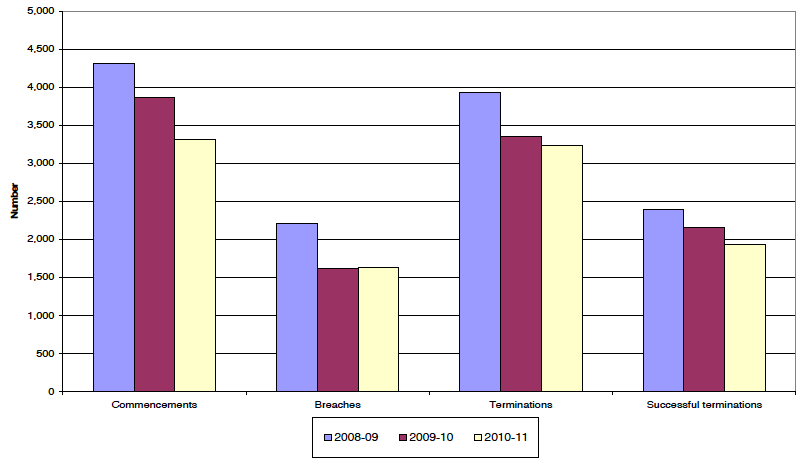
4.43 A total of 3,300 SAOs were imposed on 2,800 individual offenders in 2010-11, a decrease of 14 per cent in the number of orders compared to 2009-10 ( Table 1) and the lowest since 2006-07. Eighty-eight per cent of SAOs were made in respect of males ( Table 2).
4.44 The decrease in the number of SAOs is the net result of a number of varying changes at local authority level, with some showing decreases and some showing increases. Further information is provided in the extra datasets on SAOs at CJA/ LA level which accompany this publication.
4.45 Feedback from local authorities suggests that the sharp fall in numbers may be due to at least one of the following factors:
- The introduction of fine officers which has resulted in Justice of the Peace ( JP) courts issuing fewer SAOs.
- Some JP courts stopping imposing SAOs as a consequence of a court backlog.
- Dissatisfaction with the breaches rate for this disposal.
4.46 The incidence of SAOs was highest amongst 21 to 25 year olds (25 per 10,000 population) followed by 18 to 20 and 26 to 30 year olds (19 and 18 per 10,000 population respectively).
4.47 Females receiving SAOs tended to be older than males, with 65 per cent of orders for females and 56 per cent for males being given to offenders aged over 25 years.
4.48 Table 18 shows that Sheriff Courts imposed the largest number of SAOs (75 per cent of the total). This reflects a change from 2009-10 due to the drop in numbers imposed by Justice of the Peace courts.
4.49 The majority (67 per cent) of SAOs were made to offenders who were unemployed or not seeking employment, although this was down from 73 per cent in 2009-10 ( Table 3).
4.50 In 2010-11, 96 per cent of SAOs where information on ethnicity could be provided, related to offenders whose ethnic origin was white ( Table 4).
4.51 The average length of an SAO in 2010-11 was 47 hours, an increase from 43 hours in 2009-10 and 40 hours in 2008-09 ( Table 5). The increase over the last year is likely to be connected to the decrease in the number of SAOs imposed by Justice of the Peace courts, as these are generally given for less serious offences. The average length of an SAO given to males in 2010-11 was 48 hours, much greater than the average for females of 41 hours.
Breach Applications of SAOs
4.52 There were 1,600 breach applications in respect of SAOs made to the Courts in 2010-11, a 1 per cent increase on 2009-10 ( Table 1, Table 19 and Chart 6). The number of individuals with breach applications was 1,290, a decrease of 2 per cent from the 2009-10 total of 1,310.
Chart 6 Commencements, breaches and terminations of SAOs, 2008-09 to 2010-11
4.53 The number of breach applications is not directly comparable with the number of orders provided in paragraph 4.43 (which covers new orders only) as some of the breach applications may relate to orders started in the previous year. However, as SAOs are expected to be completed within a 12 month period (and usually within 6 months), the number of orders started in 2010-11 (3,300) can be taken as a proxy measure for the number of orders active during the year. This suggests that around half of all orders result in a breach application ( Table 1).
4.54 Sixty-five per cent of breach applications were made to Sheriff Courts with a further 34 per cent to the Justice of the Peace Courts and less than 1 per cent to Stipendiary Magistrates. The majority of breach applications (86 per cent) were made in respect of males ( Table 19).
4.55 In 2009-10, 13 per cent of breach applications resulted in the original order being revoked and a custodial sentence being imposed. A further 23 per cent were continued without further action, and 11 per cent were continued with hours varied. The outcome was not yet known for 22 per cent of breach applications, down from 26 per cent in 2009-10 ( Table 20).
Terminations of SAOs
4.56 A total of 3,200 SAOs were terminated in 2010-11, a decrease of 3 per cent from the previous year's total of 3,300 ( Table 21 and Chart 6). Sixty per cent (1,900) were successfully completed in 2010-11, compared with 65 per cent (2,200) in 2009-10. In 2010-11, 6 per cent were revoked following a review, 24 per cent were revoked following a breach application to the court and the remaining 10 per cent were terminated for other reasons (including transfer to another area and death of the offender).
V. Community Payback Orders ( CPOs)
(Table 22)
4.57 The new Community Payback Order ( CPO) was introduced from 1 February 2011, to replace CSOs, POs and SAOs for offences committed on or after that date. A CPO can consist of one of more of the following requirements: a. An offender supervision requirement, b. A compensation requirement, c. An unpaid work or other activity requirement, d. A programme requirement, e. A residence requirement, f. A mental health treatment requirement, g. A drug treatment requirement, h. An alcohol treatment requirement i. A conduct requirement.
4.58 Figures for the number of CPOs were not collected from local authorities for 2010-11 as the numbers imposed in that year was always expected to be low for the following reasons: a. CPOs were introduced only two months before the end of year 2010-11, and b. Because CPOs can only be imposed on offenders who have committed their crimes on or after 1 February 2011, for the majority of offences committed in 2010-11 which led to a CPO being imposed, that CPO would usually be imposed in 2011-12. Figures have been obtained from the Scottish Court Service on the number of CPOs in the early months since their introduction. These figures, which are also published on the criminal justice social work datasets page on the Scottish Government website, are in Table 22. This shows that the number of CPOs recorded by Scottish Court Service in February and March 2011 was indeed low, at only around 330.
4.59 Table 22 also shows that:
- A fifth of total orders were issued with a provision to conduct progress reviews.
- Fifty-five per cent of orders consisted of just one requirement (either an unpaid work or other activity requirement or an offender supervision requirement), with 22 per cent having two requirements and 17 per cent having three.
- Every order must have either an unpaid work or other activity requirement or an offender supervision requirement or both. Seventy-two per cent of orders had an unpaid work or other activity requirement while 56 per cent had an offender supervision requirement, with 28 per cent of all orders having both.
- There are seven other requirements which can be issued with a CPO at first disposal - these can only be issued together with an offender supervision requirement. Of these seven requirements, the most commonly issued were conduct (71), alcohol treatment (32) and programme (28).
The number of breaches and terminations of CPOs in this period is not known.
VI. Drug Treatment and Testing Orders ( DTTOs)
(Tables 1 to 5&23 to 24,Chart 7)
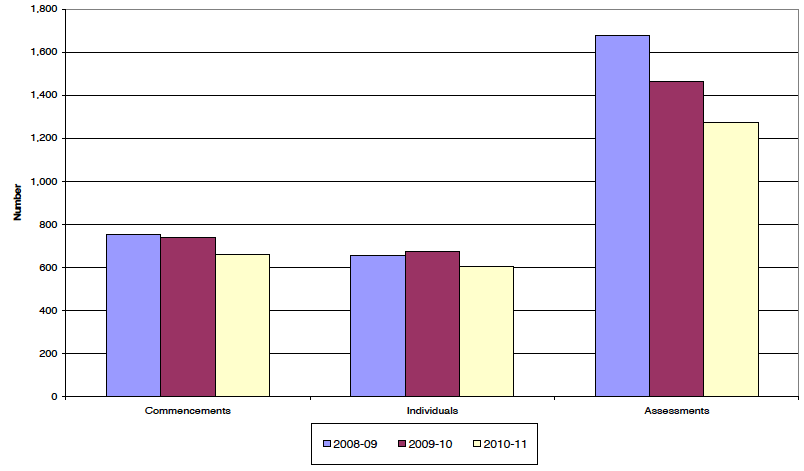
4.60 The DTTO is available to the High Court and all sheriff courts in Scotland. A total of 660 DTTOs were made in 2010-11, a decrease of 11 per cent on 2009-10 and back to around the levels of 2006-07. In 2010-11, around 1,300 DTTO Assessments were made, a decrease of 13 per cent on the previous year's total ( Table 1 and Chart 7).
4.61 A large number of authorities saw a decrease in DTTOs between 2009-10 and 2010-11. However, the overall 11 per cent decrease is dominated by a decline within the City of Edinburgh council area, from 221 orders issued in 2009-10 (30 per cent of the total) to 168 in 2010-11 (25 per cent of the total). This variation may reflect the fact that DTTO IIs are being piloted in the Lothians area. Numbers were high in 2009-10 as offenders were give a DTTO II and subsequently the capacity of this project was reached which had an impact of reducing the numbers in future years. Further information on DTTOs at local level is provided in the extra datasets on DTTOs at CJA/ LA level which accompany this publication.
4.62 Male offenders accounted for 81 per cent of DTTOs ( Table 2). Females receiving DTTOs were generally younger, with 39 per cent of all females aged 25 or under, compared with 17 per cent for males.
4.63 The incidence of DTTOs was highest amongst 26 to 30 year olds (5 per 10,000 population).
4.64 Ninety-four per cent of DTTOs were imposed on unemployed offenders or those not seeking employment, an increase from 88 per cent in 2009-10. Three per cent of DTTOs were imposed on offenders employed, self employed, in full time education or on a government sponsored training scheme ( Table 3).
Chart 7 DTTO Commencements, individuals and assessments, 2008-09 to 2010-11
4.65 Ninety-seven per cent of DTTOs in 2010-11 (where ethnicity information was known and provided) related to offenders in the white ethnic group ( Table 4).
4.66 The average length of a DTTO in 2010-11 was 18 months, similar to 2009-10 ( Table 5). The average length of a DTTO given to males was similar to that given to females.
Breach Applications of DTTOs
4.67 There were 230 breach applications made to Courts in 2010-11 in respect of DTTOs, an increase of 16 per cent from 200 in 2009-10 ( Table 23). Males accounted for 62 per cent of these applications. The number of breach applications is not directly comparable with the number of orders previously provided (which covers new orders only) as some breach applications may relate to orders started in the previous year.
4.68 Around 29 per cent of breach applications resulted in the original order being revoked and a custodial sentence imposed, similar to the figure for 2009-10 of 28 per cent. In 2010-11, 2 per cent resulted in revocation and a new DTTO imposed whilst a further 23 per cent resulted in revocation and some other action taken. In 4 per cent of applications, the DTTO was continued and varied. A further 5 per cent resulted in no further action taken by the court, a decrease from 8 per cent in 2009-10. A quarter of outcomes were not yet known.
Terminations of DTTOs
4.69 A total of 590 DTTOs were terminated in 2010-11, an increase of 7 per cent on the 550 terminations in 2009-10 ( Table 24). Forty-five per cent (270) were successfully completed in 2010-11, the highest proportion since data was first collected on DTTOs in 2003-04. Twenty-nine per cent were terminated following a breach application in 2010-11 (up from 26 per cent in 2009-10). Seventeen per cent were revoked due to review in 2010-11, with the remaining 8 per cent terminated for other reasons (including transfer out of the area or death).
There is a problem
Thanks for your feedback