Review of Equality Evidence in Rural Scotland
This review focuses on 6 protected characteristics of age, disability, race, religion, sex and sexual orientation and considers how presence of these protected characteristics may impact on access to, and satisfaction with, service provision in rural Scotland.
3 RURAL KEY FACTS FOR PROTECTED CHARACTERISTICS
3.1 The following section outlines the key facts available in relation to age, disability, ethnicity, religion, sex and sexual orientation in a rural Scottish context.
Age
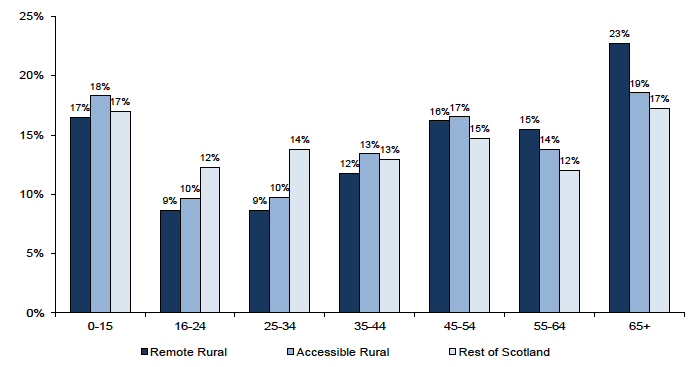
3.2 Rural areas in Scotland have a much higher proportion of the population aged 65 years and over and have a lower proportion of the population in the 16-34 age group.
3.3 Just under a quarter of the population in remote rural areas is aged 65 years and over, compared with 19% in accessible rural areas and 17% in the rest of Scotland (Fig 1).
3.4 In addition, rural areas in Scotland have a much higher proportion of the population aged 45 years and over. Over half (54%) of the remote rural population belong to this age cohort. The comparable figures in accessible rural areas and the rest of Scotland are 50% and 44% respectively. The high numbers in this age cohort in rural Scotland has important implications for the future aging of the population there.
Figure 1: Age Distribution of Population by Geographic Area, 2013[5]

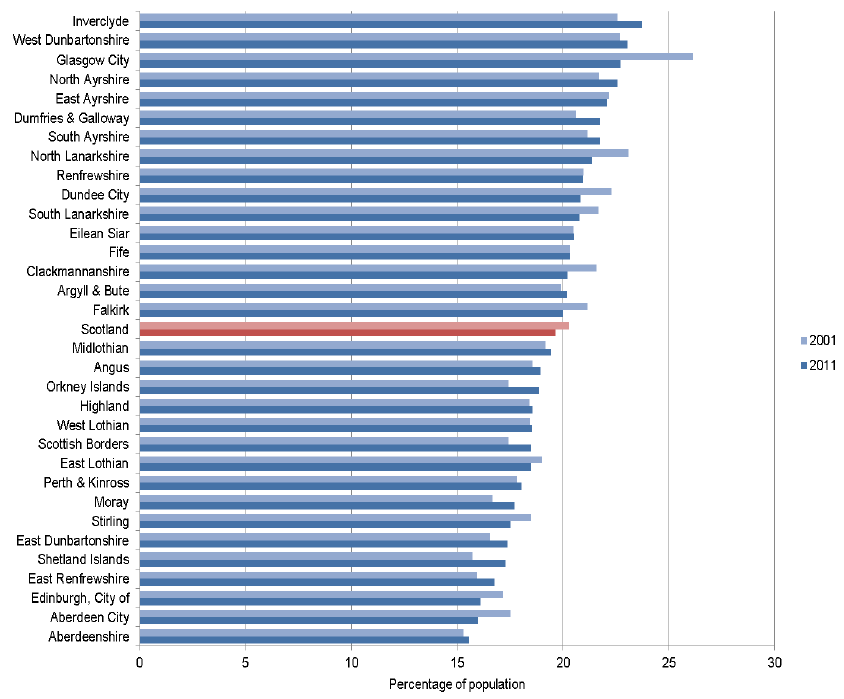
3.5 According to the latest census figures there are 6 council areas in which one fifth of the population are aged 65 and over: Argyll and Bute, Dumfries and Galloway, Eilean Siar, South Ayrshire, Scottish Borders and Perth and Kinross. Between 2001 and 2011 Orkney's population aged 65 and over increased by almost a third and Shetland's by almost a quarter.
3.6 In contrast and despite average levels of children (0-16) living in rural Scotland, the number of young people (aged 16-34) is substantially lower than in urban Scotland. Around 18% of the population in remote rural areas and 20% of accessible rural areas are aged 16-34 compared with 26% for the rest of Scotland[6].
3.7 A recent article by Atterton and Brodie (2014) showed that migration of young people in rural Scotland was complex and that any policy response would similarly need to be tailored to circumstances. They identified 4 types of youth migration patterns (positive net migration of young people aged 26-30); high population churn in and out amongst all young people; low population churn and negative net-migration of younger young people (aged 18 to 21) (in Skerratt et al, 2014).
Disability
3.8 Levels of disability are lower overall in rural areas compared to urban areas, although higher rates are observed in remote small towns.
3.9 According to the Scottish Household Survey, overall there is a lower proportion of adults with a long term limiting illness or disability living in rural areas compared to urban areas. In 2012, 21% of the rural population reported having a disability or long term limiting illness compared with 26% in urban areas. This lower proportion is despite the fact that there is a higher proportion of older people living in rural areas and that the prevalence of disability and long term limiting illness increases with age.
3.10 However, a substantially higher percentage of the population in remote small towns reported having a disability or long term limiting illness compared with remote rural areas (32% and 22% respectively, Scottish Household Survey 2012).
3.11 Levels of disability in rural Scotland vary according to local authority area. According to the latest Census figures (Fig 2) the lowest prevalence of long-term activity-limiting health problems or disability was recorded in Aberdeenshire at 16%, while Eilean Siar was above average at 21%[7].
Figure 2: Long-term activity-limiting health problem or disability by council area, Scotland, 2001 and 2011 (Census, 2001 and 2011)

3.12 Many of the smaller and more rural councils often with ageing populations also recorded increasing levels of disability between 2001 and 2011, for example Shetland (17%) and Orkney (19%), Dumfries and Galloway (22%) (Census 2011).
Ethnicity (Race)
3.13 As this review considers sociological issues including behaviour and culture the term ethnicity has tended to be used instead of the term race.
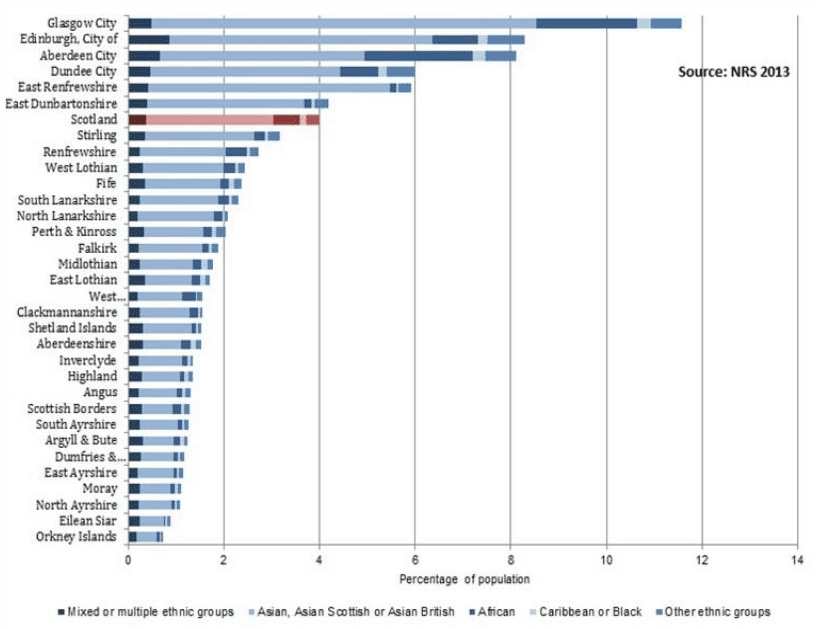
3.14 While the largest concentrations of ethnic minorities are found in Glasgow, Edinburgh, Aberdeen city and Dundee city, there are people from minority ethnic groups dispersed throughout Scotland including rural areas (Fig 3).
Figure 3: Minority ethnic groups by council area, Scotland, 2011

3.15 The size of the minority ethnic population doubled from 2% to 4% (just over 200,000) of the total population of Scotland between 2001 and 2011. While the largest increases have occurred in the four cities listed above, every council area of Scotland has seen an increase in this time period in the proportion of their population who were born outside of the UK. According to latest census figures all council areas except for Eilean Siar and Orkney Islands have more than 1% of their population from a minority ethnic group[8].
Religion
3.16 There has been a decrease in stated religious affiliation in both urban and rural areas since 2001 (Table 2).
3.17 According to the Census[9], there was an 11 percentage point fall between 2001 and 2011 in the proportion of people reporting they had a religion. This decrease occurred in every council area, though some of the more rural council areas experienced the largest falls, for instance, in Angus there was a decrease of 14 percentage points.
3.18 The proportion of the Scottish population who recorded their religion as Church of Scotland fell by a fifth since 2001. Only one council, Eilean Siar experienced an increase (5%) in the proportion of people identifying as Church of Scotland.
Table 2: Religion of Respondents in Urban and Rural Scotland
(Scottish Household Survey, 2011)
| Adults | Data year | All | ||||||
|---|---|---|---|---|---|---|---|---|
| 2011 | ||||||||
| 6 fold Urban / rural (as in 1999 SHS Ann. Rep.) | ||||||||
| Large urban areas | Other urban areas | Accessible small towns | Remote small towns | Accessible rural | Remote rural | |||
| None | 39 | 45 | 45 | 41 | 45 | 39 | 42 | |
| Church of Scotland | 28 | 33 | 36 | 38 | 38 | 40 | 32 | |
| Roman Catholic | 21 | 15 | 11 | 9 | 8 | 6 | 16 | |
| Other Christian | 8 | 6 | 7 | 11 | 8 | 13 | 8 | |
| Muslim | 3 | 1 | 0 | 0 | 0 | 0 | 1 | |
| Buddhist | 0 | 0 | . | 0 | 0 | 0 | 0 | |
| Sikh | 0 | 0 | . | . | . | . | 0 | |
| Jewish | 0 | . | . | . | . | 0 | 0 | |
| Hindu | 1 | 0 | . | 0 | . | . | 0 | |
| Another religion | 1 | 1 | 1 | 1 | 1 | 2 | 1 | |
| Base | N | 4520 | 3940 | 1110 | 720 | 1380 | 1220 | 12890 |
Sex (Gender)
3.19 There were more women than men in Scotland in 2011 (51.5% compared to 48.5%).
3.20 According to latest Census figures, this is the case for all council areas except the Shetland Islands[10].
Sexual Orientation
3.21 There is no sexual orientation question in the Census, resulting in a lack of any baseline data in respect of the lesbian, gay and bisexual population in Scotland.
3.22 However, for the first time in 2011 the Scottish Household Survey included a question on the sexual orientation of respondents. According to this survey data, 98% of adults in Scotland identified themselves as heterosexual or straight, whilst just under 1% identified themselves as lesbian, gay or bisexual. Statistics published by the Integrated Household Survey show that the number of people who self- identified as lesbian, gay or bisexual in Scotland was 1.5%, the same number as in the UK as a whole. However, it is important to note that the surveys may underestimate the lesbian, gay and bisexual population due to under-reporting. In 2008, a report published by the Scottish Government (2008a) estimated that lesbian, gay and bisexual people made up around 5% of the Scottish population.
3.23 According to the survey there are slightly less people identifying as gay lesbian or bisexual in rural areas compared to urban areas (0.5% and 1.2% respectively).
Contact
Email: Liz Hawkins
There is a problem
Thanks for your feedback