Results from the December 2012 Scottish Agricultural Survey
This publication contains results from the 2012 December Agricultural Survey covering
winter sown crops, hay and silage production, livestock and machinery. It provides
commentary and graphics on the latest annual changes and trends over the past ten years,
together with comparisons with June Census results.
This document is part of a collection
3. Commentary
3.1 Winter Crops (Table 1)
Year-on-year comparisons between 2011 and 2012 December Survey results show:
- An overall decrease in the area of winter crops, of 9,773 hectares (5.2 per cent) to 179,718 hectares.
- A decrease in winter wheat of 14,556 hectares (14.8 per cent) to 84,070 hectares.
- An increase in winter barley of 5,079 hectares (10.4 per cent) to 53,908 hectares.
- An increase in winter oats of 315 hectares (4.9 per cent) to 6,695 hectares.
- A decrease in winter oilseed rape of 611 hectares (1.7 per cent) to 35,045 hectares.
The decreases in wheat and oilseed rape reflect the wet weather in autumn 2012. These conditions meant the 2012 harvest was delayed and some farmers had difficulties in sowing winter crops for the 2013 harvest. Wheat displayed the greatest change of all of the winter crops, down 14,556 hectares (14.8 per cent). Despite this, areas of oats and barley rose, perhaps owing to some substitution with winter wheat.
Chart 1 illustrates winter and spring crop areas from the 2010/11 and 2011/12 growing years, together with the latest December 2012 data, with spring varieties prominent for barley and oats and winter varieties prominent for wheat and oilseed rape. Changes between crops have accounted for more of the change than changes between winter and spring sowing, so reductions in oilseed rape this winter may not result in an increase in spring oilseed rape.
Chart 1: Winter and Spring Crops, 2011 and 2012 June Census, and December 2012 Survey
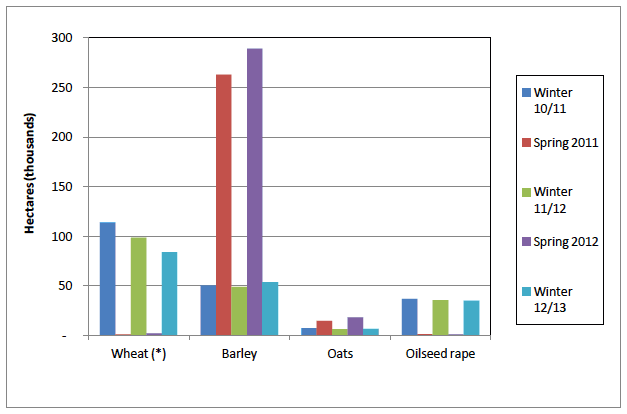
* Spring wheat estimates are calculated by subtracting December figures from June figures from the following year.
The December Survey provides the first indication of trends of winter sown crops, with more comprehensive results produced from the June Census in the following year. June Census results are more comprehensive in the sense that they are based on a larger sample of holdings, and since 2009, include all crop areas reported by holdings claiming Single Farm Payments and other schemes through the Single Application Form (SAF). In addition, June Census results include crops grown on minor holdings, which are excluded from December Survey results, although these are estimated to comprise less than one per cent of crop areas.
Chart 2 shows trends in winter crops reported in the December Survey and June Census over the past ten years. Results are presented against the year of harvest, so for example the 2011 December Survey results are presented against June Census results from 2012, which is when these crops would be harvested. For wheat, the chart shows winter wheat reported in the December Survey and total wheat (including any spring wheat) reported in the June Census, as these are not split in the June Census.
Chart 2: Winter crops, December Survey and June Census by year of harvest
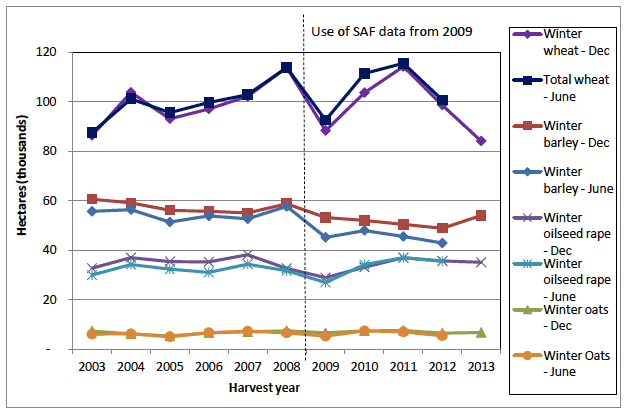
For most years, December Survey and June Census results are similar to each other. It is interesting to note that for barley and, until 2010, oilseed rape, the December Survey results have tended to be slightly higher than June Census results. One possible explanation for this could be that the June Census specifically requests crop areas for combine harvesting and the production of grain and oilseeds, which excludes any areas used for other purposes such as whole crop arable silage or where lower quality crops will not be combine harvested. This distinction is not made in the December Survey, which reports all crops sown by 1st December. For most years, June Census total wheat areas have been slightly higher than December Survey results. This is partly due to June Census results including small areas of spring wheat. Also, it is possible to sow winter wheat after the 1st December, which will not be picked up by the December Survey.
Further information on long term trends of cereal and oilseed rape areas in the context of other land use can be found in the 'Final Results From the 2012 June Agricultural Census' publication. [1]
Further information on long term trends of cereal and oilseed rape production can be found in the 'Final Estimate of Cereal and Oilseed Rape Harvest 2012' publication. [2]
3.2 Production of hay, silage/haylage and arable silage (Table 1)
Chart 3 shows the production of hay, silage/haylage and arable silage on main agricultural holdings between 2002 and 2012. These results exclude any production on minor agricultural holdings, which, for example, accounted for 12 per cent of grassland and one per cent of crops in 2008 when data were last available. Note that these proportions will have varied slightly over the ten year period and therefore contributed to some of the variation in the trends.
Year-on-year comparisons between 2011 and 2012 show:
- An decrease in grass silage/haylage production of 218,677 tonnes (3.3 per cent) to 6.41 million tonnes.
- A decrease in arable silage production of 17,582 tonnes (5.6 per cent) to 298,938 tonnes.
- A decrease in the production of hay of 80,191 tonnes (30.8 per cent) to 179,750 tonnes, the lowest quantity on record.
Chart 3: Production of hay, silage/haylage and arable silage, 2002 to 2012
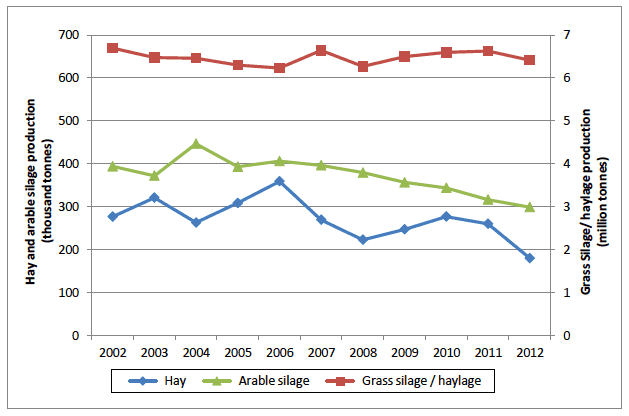
Please note that to aid comparison of trends the production of grass silage/haylage is shown against the right hand axis in Chart 3, which is expressed in terms of million tonnes, whereas hay and arable silage production is expressed in terms of thousand tonnes on the left hand axis.
In terms of total tonnage, grass silage/haylage accounted for 93 per cent of production in 2012, with arable silage four per cent and hay three per cent. However, this does not take into account dry matter and nutrient content, which is higher per tonne in hay and arable silage.
Longer term trends show that the production of silage/haylage has ranged between 6.2 and 6.7 million tonnes over the past ten years. Arable silage production increased between 2002 and 2004 and has generally decreased each year since then. Hay production decreased greatly over the last year, due to the wet conditions described in section 3.1.
3.2.1 Hay: Areas & Yields
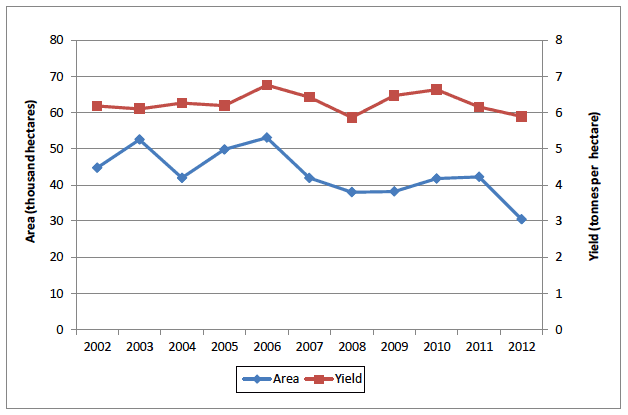
Trends in the production of hay are determined by associated areas of grass cut for hay and by yields. Chart 4 illustrates how the area of grass cut for hay has decreased substantially, by 14,244 hectares (32 per cent) over the past ten years, to 30,505 hectares in 2012 (using the left hand axis). During this period, yields also fell by 0.3 tonnes per hectare (4.6 per cent) to 5.9 tonnes per hectare in 2012 (using the right hand axis).
Chart 4: Area of grass cut for hay and yields of hay, 2002 to 2012
3.2.2 Silage and Haylage : Areas & Yields
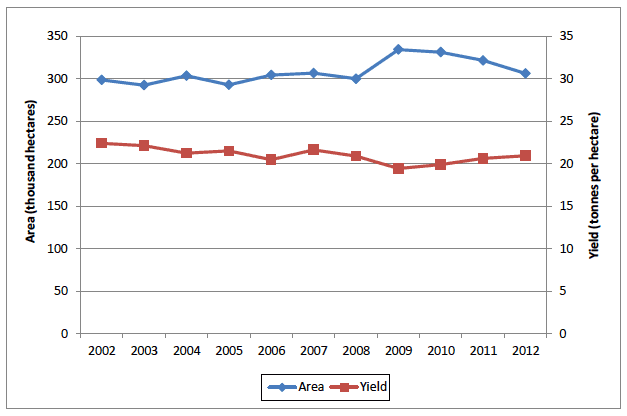
Chart 5 shows trends for areas and yields of grass cut for silage/haylage production. Over the past ten years, areas have increased by 7,541 hectares (2.5 per cent) to 306,271 hectares (using the left hand axis), whereas yields have decreased by 1.5 tonnes per hectare (6.6 per cent) to 20.9 tonnes per hectare (using the right hand axis).
Chart 5: Area of grass cut for silage/haylage and yields 2002 to 2012
For silage and haylage production, several cuts of grass can be taken from the same area in a single year. The yields reported here correspond to total production, which incorporates all cuts of grass taken from the corresponding area.
In 2012, the total area of grass reported on the December Survey for the production of hay, silage and haylage was 336,776 hectares. This represents 25 per cent of the 1.33 million hectares of grass area reported on main holdings in the 2012 June Census.
3.2.3 Arable Silage : Area, Yield and production
Separate information on the area of arable silage is not collected on the December Survey, so it is not possible to produce a corresponding analysis of areas and yields. Production of arable silage will be determined by a range of factors. These include trends in areas of arable crops, which are collected on the June Census, but also decisions by farmers on how much of this crop to use for arable silage. This in turn may be determined by the quality of these arable crops, with poorer crops generally being used for animal feed, including arable silage.
3.2.4 Grass sown
The area of grass sown in each of the last ten years has ranged from between 40,813 and 63,000 hectares. In 2012 there was a decrease of 1,484 (3.2 per cent) to 45,576 hectares. The total area sown equates to 3.4 per cent of the total grass area on main holdings at 1st June 2012 (1.33 million hectares). Of the total sown, 18,222 hectares was under-sown to cereal or other crops (grass and cereals grown together allowing grass to establish ready for autumn grazing whilst still giving a useful yield of grain) and 27,354 hectares was directly sown or reseeded.
The next four sections present livestock results from the December Survey alongside comparisons with the June Census. The December Survey provides complementary information to the June Census, as it provides a snapshot of the livestock populations for the winter months, as at 1st December. A more comprehensive analysis of longer term livestock trends can be found in "Final Results From the 2012 June Agricultural Census".[3]
The December Survey results are based on main agricultural holdings only, so exclude any livestock kept on minor agricultural holdings. Livestock on minor agricultural holdings in 2008, when December data were last available, was estimated as: 8,926 cattle (0.5 per cent of the total); 228,864 sheep (3.2 per cent of the total); 1,826 pigs (0.4 per cent of the total) and 49,683 poultry (0.4 per cent of the total). Note that these totals will have varied slightly over the last ten years and therefore contributed to some of the variation in trends and comparisons between the December Survey and June Census results.
3.4 Cattle (Table 2)
Year-on-year comparisons between 2011 and 2012 December Survey results show:
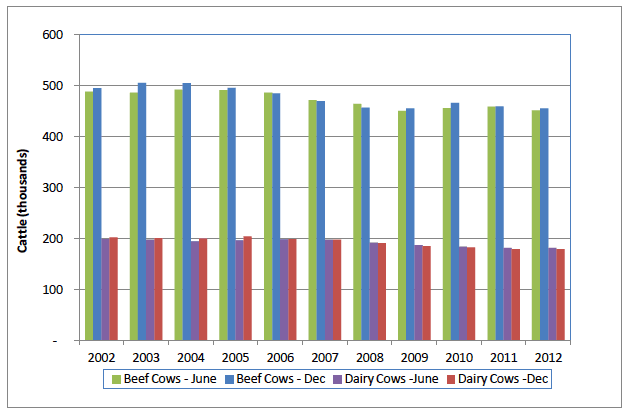
- A decrease in total cattle of 8,412 (0.5 per cent) to 1.72 million - lower than the 0.9 per cent decrease reported between June Census results.
- A decrease in the beef cows of 3,952 (0.9 per cent) to 456,155 - slightly lower than the decrease of 1.5 per cent reported between June Census results.
- A decrease in the dairy cows of 450 (0.3 per cent) to 179,173, a new record low. The fall is similar to the small 0.02 per cent decrease reported between June Census results.
Chart 6: Beef and Dairy herds, June and December, 2002 to 2012
Declining numbers of beef cows in both the December Survey and the June Census may be attributed in part to farmers reacting to high beef prices by selling more of their beef cows for cull.
A comparison of trends over the past ten years for the beef and dairy herds from the December Survey and June Census are shown in Chart 6. It shows that numbers vary little between the December Survey and June Census results, though since 2009, the dairy herd has tended to be marginally smaller in December, and the beef herd marginally larger. Over the past ten years, December Survey results for the beef herd have ranged between being 1.6 per cent lower (in 2008) and 3.5 per cent higher (in 2003) than June Census results. For the dairy herd the differences have ranged between being 1.7 per cent lower (in 2012) and 3.9 per cent higher (in 2003) than June Census results.
Greater differences occur between December Survey and June Census results when considering the profile of cattle at different stages of the production cycle. Chart 7 shows the profile of beef cattle in June and December 2012. In December there were 147,718 (40 per cent) fewer "cows and heifers in milk" but 151,435 (174 per cent) more "cows in calf but not in milk" than in June, reflecting the seasonal pattern of spring calving in the herd.
Chart 7: Profile of beef cattle, June and December 2012
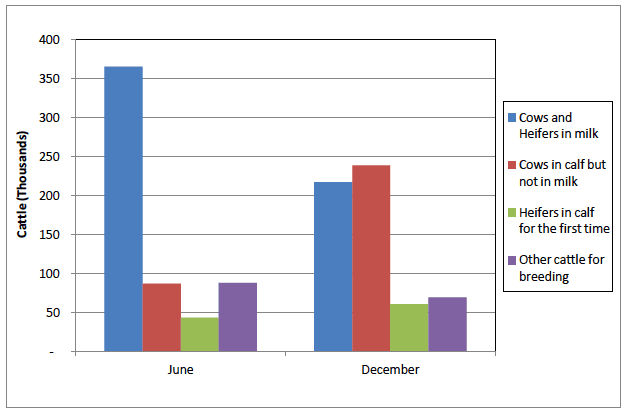
The strong seasonal pattern of spring calving in the beef herd is also reflected in the total number of calves and younger cattle reported in the June Census and December Survey. In 2012, there were 346,997 calves under six months old in June, compared to 191,605 in December. Conversely, there were 183,312 cattle aged six months to one year in June, compared to 322,379 in December.
Chart 8: Profile of dairy cattle, June and December 2012
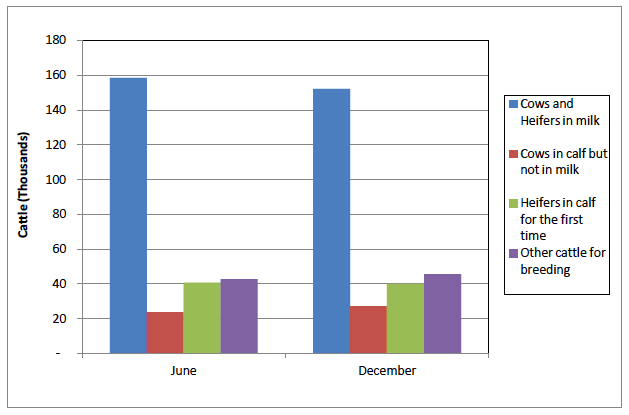
In comparison, in Chart 8, we can see that dairy cattle display a more stable profile between June and December 2012. In December there were 6,430 (four per cent) fewer "cows and heifers in milk" and 3,419 (only 14 per cent) more "cows in calf but not in milk" than in June, suggesting that compared to the beef herd, the pattern of seasonal spring calving is less pronounced in the dairy herd. This ensures less seasonality and a more constant supply of milk throughout the year.
3.5 Sheep (Table 3)
Year-on-year comparisons between 2011 and 2012 December Survey results show:
- An increase in the total number of sheep of 198,301 (4.4 per cent) to 4.66 million seen for the December survey contrasting with the one per cent decrease shown in the June Survey.
- An increase in the breeding flock of 33,750 (1.3 per cent) to 2.73 million - in contrast to the 0.7 per cent decrease reported between June Census results.
- An increase in the number of sheep under one year, up 145,091 (9.3 per cent) to 1.71 million - this is, again, in contrast to the 1.6 per cent decrease in lambs seen between June Census results.
Chart 9 shows trends over the past ten years for lambs and for the breeding flock from the December Survey and June Census. The trends are very similar, with the December Survey and June Census both showing reductions of 14.5 to 16.5 per cent (or around 800 thousand sheep in terms of December figures) over the past ten years.
Chart 9: Lambs and the female breeding flock, June* and December** 2002 to 2012
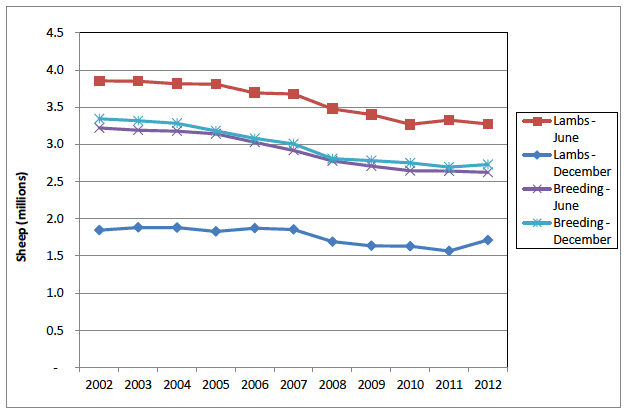
* The June breeding flock comprise ewes used for breeding in the previous season.
** The December breeding flock comprises ewes kept for breeding and shearling ewes or gimmers put to ram within the calendar year.
Over this period, the December Survey results for breeding females have ranged between being 1.1 per cent higher (in 2008) and 3.9 per cent higher (in 2012) than June Census results. Some of this disparity may be down to the differences between how sheep figures are collected in June and December, with the June Census reporting 'ewes used for breeding in the previous season' and the December Survey reporting "ewes kept for breeding" and "shearling ewes or gimmers put to the ram". This may explain some of the difference in results, as not all of the breeding intentions reported in December may have been carried out or been successful by the following June.
Greater differences occur between December Survey and June Census results when considering the profile of sheep, which are at different stages of the production cycle when each survey is undertaken. Chart 10 shows the profile of the sheep in June and December 2012. The biggest difference is in "lambs/sheep aged under one", with 1.56 million (48 per cent) fewer in December, reflecting the large number of lambs which are finished and slaughtered in the autumn. However, this reduction of 1.56 million between June and December 2012 compares with the figure of 1.76 million (53 per cent) between June and December in 2011, with the smaller figure in 2012 possibly due to falling lamb prices.
There is also a large difference in "other sheep aged one year and over", with 0.61 million (81 per cent) fewer in December. It should be noted that most of the sheep counted as "other" in June will be counted within the breeding flock by December, having replaced older ewes which have been slaughtered after coming to the end of their productive lives.
Chart 10: Profile of sheep, June and December 2012
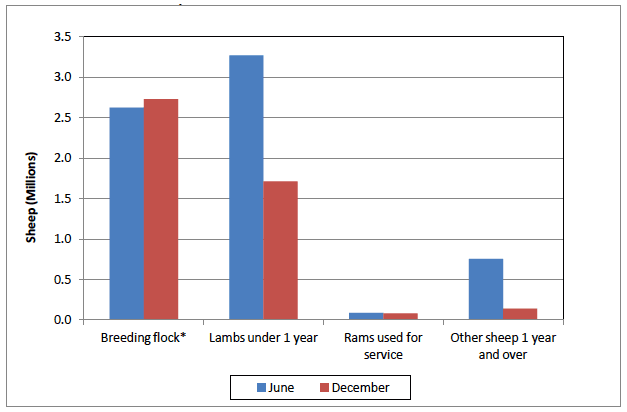
* The June breeding flock comprise ewes used for breeding in the previous season. The December breeding flock comprises ewes kept for breeding and shearling ewes or gimmers put to ram within the calendar year.
3.6 Pigs (Table 4)
Year-on-year comparisons between 2011 and 2012 December Survey results show:
- A decrease in the total number of pigs of 46,971 (12.8 per cent) down to 321,097, the lowest on record. The drop was larger than the 6.8 per cent decrease reported in the 2012 June Census results.
- A decrease in breeding pigs of 4,092 (12.7 per cent) down to 28,135 - comparable to the 12.3 per cent decrease reported in the 2012 June Census results.
The higher rate of decline for pigs reported through the December survey in comparison with the June Census may be largely attributable to movement of stocks to England following the closure of Hall's meat processing plant in October 2012, as well as to high feed prices.
Chart 11 shows trends over the past ten years for breeding pigs from the December Survey and June Census. The long term trends are fairly similar with the December Survey showing a decrease of 22,269 (44.2 per cent) over the ten year period, compared to a decrease of 23,744 (42.7 per cent) from the June Census.
Chart 11: Breeding pigs, June and December 2002 to 2012
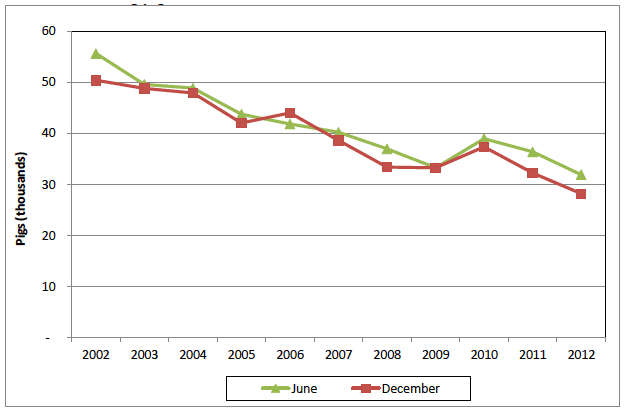
Over this period, December Survey results for breeding pigs have been lower than June Census results for most years and range from being 11.7 per cent lower (in 2012) to 5.1 per cent higher (in 2006).
Chart 12: Pig profile, June and December 2012
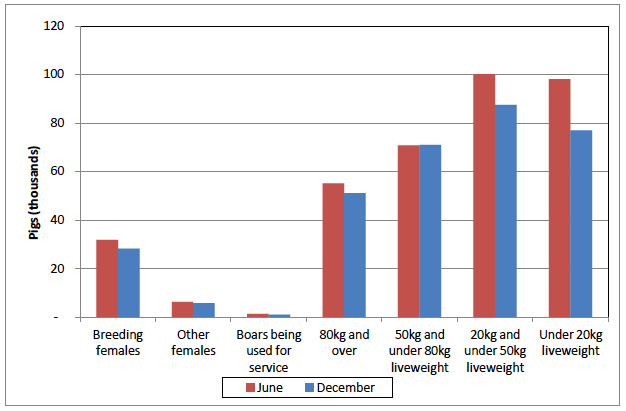
Chart 12 compares the profile of pig populations in June and December 2012. The biggest difference is for pigs weighing under 20kg, with 21,198 (22 per cent) more recorded in June. There were more pigs in June than in December for all categories apart from pigs between 50kg and 80kg, where December figures exceeded June's by 302 (0.4 per cent). Looking back over the last ten years, there tends to be fewer small pigs in December but there are not always more of the larger pigs. Pig populations do not show clear seasonal profiles as with other livestock, as the production cycle is not annual, with pigs able to produce two sets of litter in a year.
3.7 Poultry (Table 5)
Year-on-year comparisons between 2011 and 2012 December Survey results show:
- An increase in the total number of poultry of 0.84 million (6.0 per cent) to 14.80 million - higher than the 1.2 per cent increase reported in the 2012 June Census results.
- A small decrease in birds for laying eggs of 2,098 (0.04 per cent) resulted in the number of layers remaining around five million - in contrast to the 11.4 per cent drop reported in the 2012 June Census results.
- An increase in the number of broilers of 1.15 million (15.2 per cent) to 8.68 million - similar to the 12.3 per cent increase reported in the 2012 June Census results.
Chart 13 shows trends over the past ten years from the December Survey and June Census for broilers (used for meat production), laying fowls (used for egg production) and breeding birds (used to produce broiler and layer chicks). It should be noted that there is some inherent variability in the annual poultry data, which can be affected by operational factors.
For some years, the chart shows large differences in the number of broilers between June and December. This variability can occur if large poultry units reduce the number of birds on their holdings on the survey date for operational reasons such as the cleaning of premises. Also the poultry production cycle is very short compared to other livestock, which provides producers with the flexibility required to change production levels in response to market conditions.
Chart 13: Poultry, June and December 2002 to 2012
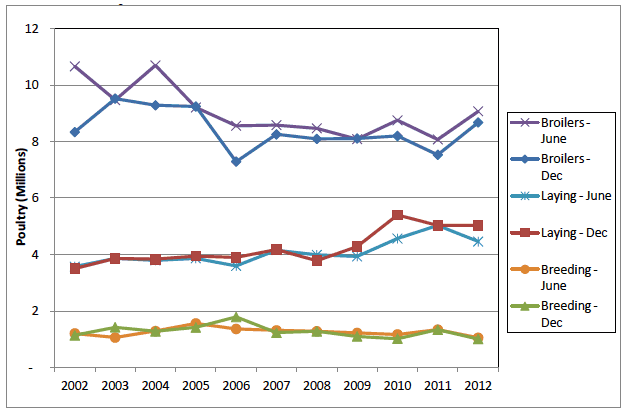
For broilers, after some quite differing figures in 2002, 2004 and 2006, the December Survey and June Census show similar steady numbers.
The figures for laying fowls had been similar until 2010. Over the ten year period the December Survey results show an increase of 1.53 million (44 per cent) compared to an increase of 0.43 million (16.4 per cent) from the June Census.
The trends in the annual number of breeding birds have been fairly constant with the December Survey and June Census both averaging just under 1.3 million birds over the ten year period.
3.8 Machinery (Tables 6, 7 and 8)
Information on machinery is only collected through the December Survey and not the June Census. Information on tractors and transport is collected every December but questions on other machinery types are alternated between odd and even reporting years. Commentary in this section only refers to trends in tractors and to those machinery types for which information is collected for in even years. Results for machinery information collected in odd years is presented in table 8 for reference.
When considering trends in machinery, it is worth noting that there has been an increase in the value of agricultural contract work being carried out over the past ten years (as reported in the farm income statistics). If it is the case that there are more holdings using contractors and their machinery to carry out certain work, it is possible this may have led to a decrease in machinery observed in the survey results,.
Tractors (Table 6)
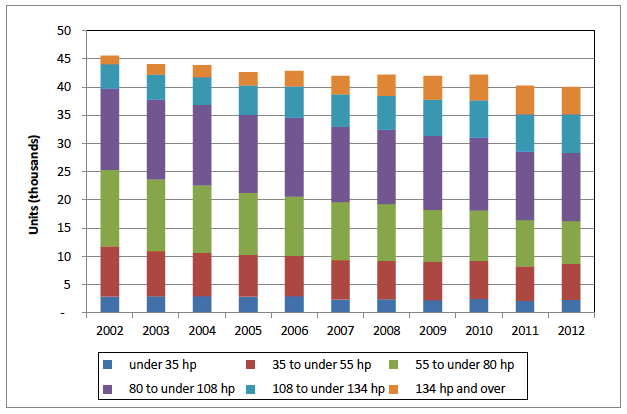
Chart 14 shows that the number of tractors on main holdings has declined over the last ten years by 5,552 (12.2 per cent) to 39,999. Over this period, the number of more powerful tractors over 108 horsepower has doubled, from 5,819 to 11,670, whilst the number of less powerful tractors has declined, most notably those between 55 and 80 horsepower which have fallen from 13,568 to 7,580 (a drop of 44.1 per cent) over the period.
Chart 14: Tractors on main holdings by horsepower, 2002 to 2012
Other machinery (Table 8)
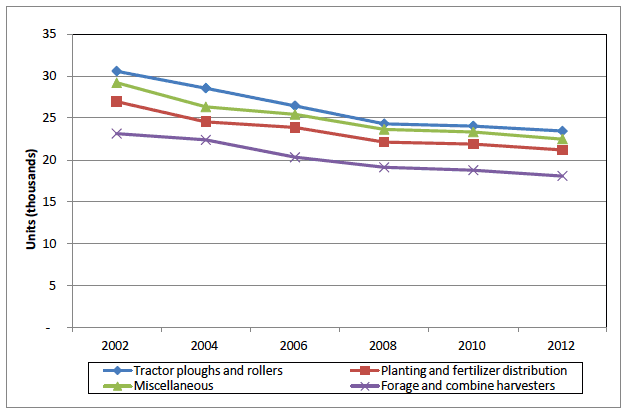
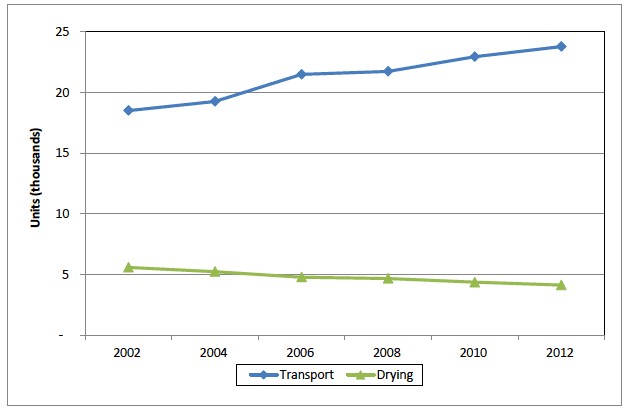
Charts 15 to 17 show the trends for other types of machinery for which information is only collected on even years of the survey. These charts show that there have been downward trends for all groups of machinery since 2002 except for transport.
Cultivation
Between 2002 and 2012 cultivation machinery, comprising tractor ploughs and rollers, decreased by 7,152 (23 per cent) to 23,441 units. There have been differing rates of decline within this total, with reversible tractors declining at a much slower rate (six per cent) in comparison to non-reversible tractors (41 per cent) and ridging tractors (34 per cent). Information on other cultivation machinery such as harrows, diggers and hoes is collected in odd years of the survey (see table 8).
Chart 15: Machinery information collected in even years, 2002 to 2012
Harvesting
Harvesting machinery for forage harvesting, combine harvesters, root harvesters and balers, as denoted by the forage and combine harvesters line in chart 15, have seen an overall decline of 5,054 (22 per cent) to 18,089 units since 2002. Within this total the greatest decline has been for forage harvesting machinery, down 1,203 (42 per cent) to 1,641 units. This compares to slower rates of decline for combine harvesters (down 17 per cent to 4,210 units) and balers (down 16 per cent to 11,354 units).
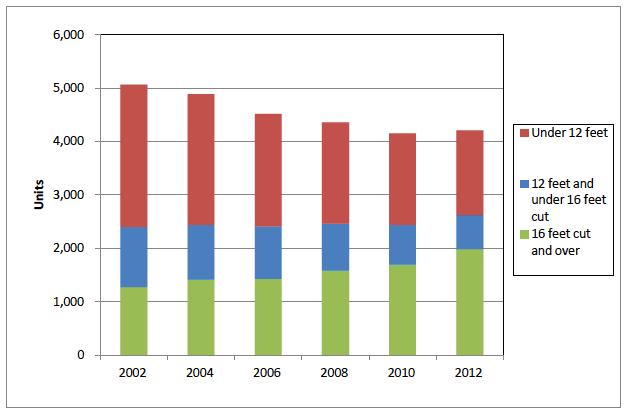
It is important to note that although combine harvesters have declined overall, larger machines with a 16 feet cut and over have increased (up 57 per cent since 2002). In contrast, smaller combines, with under 16 feet cuts, have been in decline as farmers move to using larger, more powerful machinery (see chart 16).
Chart 16: Combine harvesters by size, 2002 to 2012
Planting and fertiliser distribution
Planting and fertiliser distribution machinery is down 5,791 (21 per cent) since 2002, to 21,184 units. Most of the decline has been driven by mechanical dung spreaders (down 32 per cent to 6,314 units) and fertiliser distributors (down 21 per cent to 10,675) rather than by slurry and effluent tankers (down 2 per cent to 4,195), which have declined at a slower rate (though rising between 2010 and 2012).
Drying and storage
A 26 per cent drop in drying machinery was observed between 2002 and 2012, down 1,458 to 4,142 units. This has been driven by a decline in grain dryers installed on floors or in bins (down 1,017 to 1,086 units) rather than by other dryers such as continuous flow, batch or mobile engine driven fans.
Chart 17: Transport and Drying & storage machinery, 2002 to 2012
Transport
The number of transport vehicles, comprising lorries, vans, pick-ups and all-terrain vehicles increased by 28 per cent to 23,802 vehicles between 2002 and 2012. Within this increase, all-terrain vehicles such as three- and four-wheeled motorcycles and eight-wheeled vehicles increased at a faster rate (up 35 per cent to 12,209 vehicles) than the number of lorries, vans and pick-ups (up 22 per cent to 11,593 vehicles).
Contact
Email: Graeme Kerr
There is a problem
Thanks for your feedback