Scottish Greenhouse Gas Emissions 2012
This publication provides estimates of greenhouse gas emissions in Scotland for the years 1990 to 2012.
This document is part of a collection
Section D. Revisions Since the Last Inventory
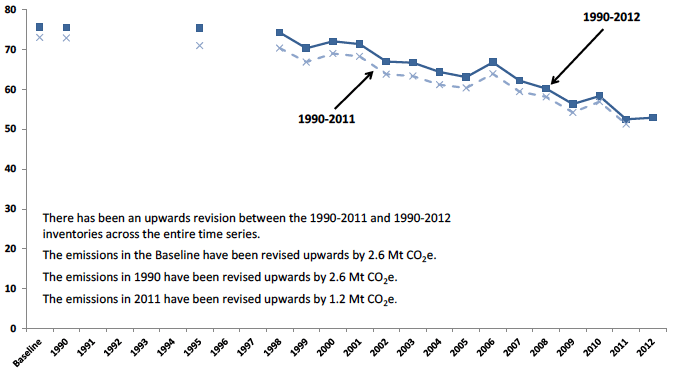
This section examines key revisions in estimated source emissions between the latest inventory (1990-2012) and the previous inventory (1990-2011) published in June 2013. Chart D1 shows the impact of the revisions on Scottish greenhouse gas emissions between 1990-2011 and 1990-2012 inventories.
Chart D1. Scottish Greenhouse Gas Emissions. Comparison of 1990-2011 and 1990-2012 Inventories. Values in Mt CO2e

Main Points
- Between the latest and previous inventories, the extent of revisions to 1990 and the baseline are greater than those to 2011 (for 1990, an upwards revision of 2.6 Mt CO2e; for the baseline, an upwards revision of 2.6 Mt CO2e; for 2011, and an upwards revision of 1.2 Mt CO2e)
- Using the previous inventory, the overall reduction in emissions between 1990 and 2011 was 21.6 Mt CO2e (29.6 per cent)
- Using the latest inventory, the overall reduction in emissions between 1990 and 2011 was 23.0 Mt CO2e (30.5 per cent)
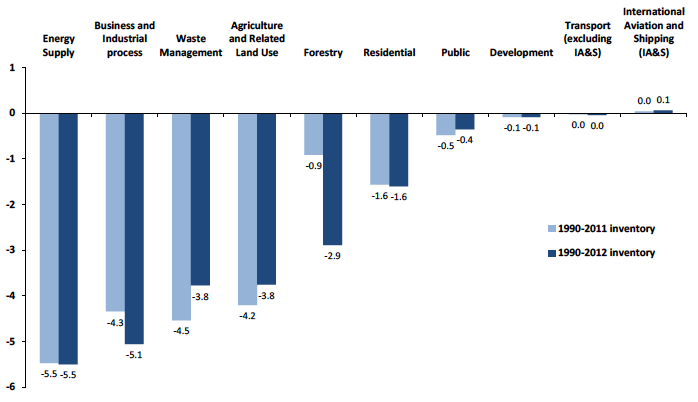
Chart D2 shows the overall reduction in emissions between 1990 and 2011 using both the previous and latest inventories by Scottish Government sector.
Chart D2. Change in Emissions Between 1990 and 2011 by Scottish Government Sector. Comparison of the 1990-2011 and 1990-2012 Inventories. Values in Mt CO2e

Main Points
- For both inventories, the greatest absolute reduction in emissions continues to be found within the Energy Supply sector, with this sector being relatively immune to revision in the latest inventory.
- The magnitude of the reduction in emissions is greater in the latest inventory for Business and Industrial Processes sector (5.1 Mt CO2e compared with a 4.3 Mt CO2e in the previous inventory).
- For the forestry sector, there has been an increase in the rate at which CO2 has been sequestered (captured) over time. Chart D2 shows that the amount of CO2 sequestered has increased over the period in the forestry sector from 0.9 Mt CO2e to 2.9 Mt CO2e.
- The size of the absolute reduction has decreased between the latest and previous inventories for the Waste Management sector (from 4.5 Mt CO2e to 3.8 Mt CO2e) and for Agriculture and Related Land Use (from 4.2 Mt CO2e to 3.8 Mt CO2e).
- For the other sectors, there has been little or no change in the magnitude of emissions increases or reductions between the two inventories.
Table D1. Impact of revisions to the latest inventory (net source emissions), by Scottish Government sector. Values in Mt CO2e
| Source Sector | Previous inventory (1990-2011) | Latest inventory (1990-2012) | ||||
|---|---|---|---|---|---|---|
| 1990 | 2011 | % changes. 1990 to 2011 | 1990 | 2011 | % changes. 1990 to 2011 | |
| Total net greenhouse gas emissions | 72.9 | 51.3 | -29.6% | 75.5 | 52.5 | -30.5% |
| Energy Supply | 22.4 | 16.9 | -24.4% | 22.4 | 16.9 | -24.6% |
| Transport (excluding IA&S) | 10.5 | 10.5 | -0.2% | 10.5 | 10.5 | -0.4% |
| International Aviation and Shipping (IA&S) | 2.4 | 2.5 | 1.7% | 2.5 | 2.6 | 2.4% |
| Business and Industrial process | 13.6 | 9.2 | -32.0% | 13.5 | 8.5 | -37.4% |
| Residential | 8.1 | 6.6 | -19.2% | 8.2 | 6.6 | -19.6% |
| Public | 1.2 | 0.7 | -39.1% | 1.7 | 1.3 | -21.2% |
| Waste Management | 6.7 | 2.2 | -67.6% | 6.7 | 2.9 | -56.4% |
| Development | 1.7 | 1.7 | -5.0% | 1.7 | 1.7 | -5.1% |
| Agriculture and Related land Use | 14.3 | 10.1 | -29.3% | 15.2 | 11.5 | -24.6% |
| Forestry | -8.2 | -9.1 | 11.1% | -7.0 | -9.9 | 41.3% |
Main Points
- This table presents the same overall messages as Chart D2 but with some additional points.
- When comparing the two inventories, the extent to which greenhouse gas emissions have been revised upwards is greater for 1990 than for 2011.
- The size of the carbon sink for Forestry in 1990 has decreased by 1.2 Mt CO2e. However, as previously noted, the rate of carbon sequestration from this revised starting point has been greater in the latest inventory than last year's inventory.
- For the Agriculture and Related Land Use sector, net emissions in 1990 have been revised upwards between the previous and latest inventories by 0.9 Mt CO2e. The extent of this upwards revision is greater for 2011 (an increase of 1.3 Mt CO2e).
- For the Waste Sector, net emissions in 1990 have remained broadly the same between the two inventories. However, the 2011 value has been revised upwards by 0.7 Mt CO2e. This results in a lower percentage reduction in this sector across the time period.
- Percentage reductions between 1990 and 2011 in the Business and Industrial Processes sector are greater in the latest inventory (37.4 per cent in the latest inventory; compared to 32.0 per cent in the previous inventory). There has been little change to the 1990 figure for this sector.
- There has been an increase to the public sector emissions for both 1990 and 2011. The percentage reduction in the latest inventory is also lower (from 39.1 per cent in the previous inventory to 21.2 per cent in the latest inventory).
A complete list of the revisions between the previous and latest inventories can be found in the National Atmospheric Emissions Inventory website[9]. Details of the most notable revisions are listed below:
Agriculture and Related Land Use
Estimates of methane (CH4) emissions have increased. This is due to the revision in the allocation of manure in various cattle management systems. Previous information about the location of this waste has been superseded, with a knock-on effect on the quantity of methane emissions.
Waste Management
There have been higher estimates of methane (CH4) emissions from landfills in recent years (with much lower revisions for the early part of the time series). This is because data are now available on methane directly emitted from landfill gas collected and burnt in landfill gas engines and flares. Previously, emissions were estimated using energy statistics on landfill gas use in generation and landfill gas capture rate assumptions and derived gas flaring volumes.
Forestry
Revisions affect the size of the net CO2 sink from forestry, which cause the size of the reductions to increase. This is due to a change in the methodology in models of forest land area. There is now a better representation of forest areas which have been existence before 1920. There is a better distribution of tree species, growth rates and forest management practices and a better estimation of the capture and storage of carbon within forest soils.
Public Sector
Revisions affect CO2 emissions. There has been an increase in public sector emissions since 2008 to take into account a revision in the natural gas consumption data. This revision has been caused by a reallocation of the economic classification of some buildings which consume natural gas in the underlying energy statistics. This has led to an increase in buildings classed as public sector, with a corresponding decrease in other buildings. Additionally, there have been improvements in energy mapping analysis such as the inclusion of new datasets such as Display Energy Certificates. These have over-written previous energy modelling assumptions on building energy demand, have led to a higher allocation of public sector emissions to Scotland than was previously estimated.
Business and Industrial Processes
The revisions affect CO2 emissions . There has been an increase in emissions from industrial and commercial buildings due to improved energy modelling using new data such as those on Energy Performance Certificates. The extent of this increase has not been as great as for public sector combustion from 2008 onwards, as some consumers of natural gas have been reallocated from commercial businesses to public sector combustion in the underlying energy statistics.
There has been some reallocation of emissions within the Business and Industrial Processes sector, from Manufacturing and Industry to the Chemical Industries, to maintain overall consistency in reporting of the greenhouse gas inventory and underlying energy statistics. This reallocation has been requested by reviewers from the United Nations Framework Committee on Climate Change (UNFCCC). These emissions relate to those from petrochemical and chemical industry use of various process gases and residues.
Cumulative revisions since 1990-2008
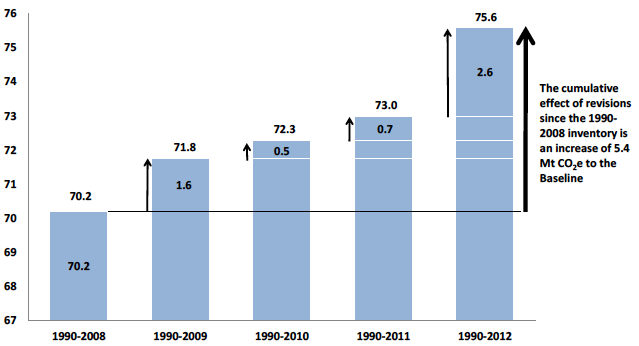
Revisions since the 1990-2008 inventory give a flavour of the scale of total revisions since the establishment of fixed annual Climate Change targets. Chart D3 shows that the average yearly increase in emissions in the Baseline has been between 1990-2008 and the latest inventory has been 1.3 Mt CO2e.
Chart D3. Revisions to the Baseline, from the 1990-2008 Inventory, to the Latest Inventory. Impact of Successive Revisions. Values in Mt CO2e

Uncertainties
Estimates of greenhouse gases are compiled by a consortium of contractors. The source emissions are based upon a range of data sources, ranging from model based estimates to point source emission data. As a result, the estimates are subject to a degree of uncertainty. Full analyses of these uncertainties are provided on the National Atmospheric Emissions Inventory website.
Future revisions to the inventory
Every year, the greenhouse gas inventories are updated to reflect improvements in the underpinning science, data and modelling which often result in revisions to the entire time series. These revisions also reflect changes to the Intergovernmental Panel on Climate Change (IPCC) guidelines. Some of the changes for the 1990-2013 inventory are already known and these are likely to increase Scotland's net emissions. Some are due to the implementation of IPCC (2006) reporting guidelines which are being implemented at a UK level. For the 1990-2013 inventory, the following changes will be incorporated and will be implemented across the time series:
- Changes to the global warming potential of methane from 21 to 25.
- Changes to the global warming potential of nitrous oxide from 310 to 298.
- Introduction of a new greenhouse gas: an F-gas, nitrogen trifluoride (NF3)
Note that there are likely to be further revisions in the 1990-2013 inventory which have not been noted within this publication. For instance, developments are underway to better model emissions and sinks from land-use change. There is also a project underway to develop more geographically specific emissions factors for some agricultural practices.
Contact
Email: Martin Macfie
There is a problem
Thanks for your feedback