Domestic abuse: statistics recorded by the police in Scotland - 2010/11 and 2011/12
Domestic Abuse Recorded by the Police in Scotland, 2010-11 and 2011-12
This document is part of a collection
3. Commentary
The statistics on domestic abuse are used to inform National Outcome 9 - 'we live our lives safe from crime, disorder and danger' as well as The Strategy for Justice in Scotland. These statistics are also used by a wide range of stakeholders to monitor trends, for policy research and development, and for research purposes.
3.1. Incidents of domestic abuse recorded by the police (tables 1a, 1b and 2, and chart 1)
- Incidents of domestic abuse recorded by the police in Scotland increased from 55,698 in 2010-11 to 59,847 in 2011-12, an increase of 7% and continuing the generally upward trend.
- 54% of the incidents recorded in 2011-12 led to the recording of at least one crime or offence. This is 4 percentage points lower than in 2010-11. In 2011-12, the highest proportion of crimes to incidents was recorded by Grampian (69%) and the lowest by Lothian & Borders (33%).
- The most common crime or offence recorded in 2011-12, as in previous years, was common assault, accounting for 44% (14,154) of all incidents where a crime or offence was recorded, followed by threatening or abusive behaviour at 17% (5,453).
- Crimes, which are generally regarded as more serious than offences, were recorded in 13% (7,710) of all incidents in 2011-12, a figure which has remained constant since 2009-10 and which is up from 8% in 2002-03.
- In 2011-12, where a crime was recorded, it was most likely to be a crime against public justice (typically bail offences and resisting arrest), accounting for 13% (4,056) of all incidents where a crime or offence was recorded, or vandalism, accounting for 6% (1,857).
- The Criminal Justice and Licensing (Scotland) Act 2010 introduced two new statutory offences, namely Threatening or abusive behaviour (section 38) and Stalking (section 39). These sections of the Act came into force in late 2010. These offences would previously have been recorded under breach of the peace and therefore the recent decreases in the number of offences of breach of the peace should be treated with caution. In 2011-12, the first full year for which these two new offences are available, there were 5,453 incidents which resulted in the recording of a main offence of Threatening or abusive behaviour, and 239 of Stalking.
3.2. Incidents of domestic abuse per 100,000 population (tables 3a and 3b)
- The number of domestic abuse incidents recorded by the police in 2011-12 ranged from 675 per 100,000 population in Grampian to 1,319 per 100,000 population in Strathclyde, compared with an overall Scottish rate of 1,139 per 100,000 population.
- In 2011-12, Strathclyde has the highest number of domestic abuse incidents where a crime or offence was recorded (842 per 100,000 population), while Dumfries & Galloway has the lowest (322 per 100,000 population).
- There was some variation between police forces in the number of incidents of domestic abuse which resulted in a referral to the procurator fiscal in 2011-12. These ranged from 245 per 100,000 population in Lothian & Borders, to 705 per 100,000 population in Strathclyde.
3.3. Incidents of domestic abuse by gender of victim and perpetrator (tables 6a, 6b and 7, and chart 2)
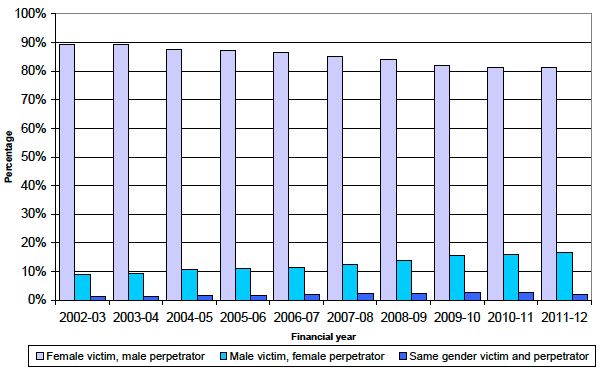
- Incidents with a female victim and a male perpetrator represented 81% of all incidents of domestic abuse in 2011-12 (where this information was recorded), the same as in 2010-11. This percentage has gradually decreased since 2002-03, when it was 89%. This is mainly the result of an increase in the proportion of incidents with a male victim and a female perpetrator, which has risen from 9% of all incidents (where this information was recorded) in 2002-03 to 17% in 2011-12.
Chart 2 Gender of victim and perpetrator where known, Scotland, 2002-03 to 2011-12.
3.4. Level of repeat victimisation (tables 8a, 8b, 9, 10a and 10b)
- For incidents where information regarding repeat victimisation of domestic abuse was available in 2011-12, 62% of the incidents involved known repeat victimisation compared to 55% in 2010-11 and 48% in 2002-03. The increase since 2002-03 could be affected by the length of time different forces have kept databases on domestic abuse, allowing repeat incidents to be identified.
- In 2011-12, where the number of previous incidents was known, 32% of cases involved a single previous incident, 30% of cases involved two or three previous incidents, and 38% involved four or more previous incidents. Please note that these are counts of incidents - victims of repeat abuse over the financial year period may be included in several repeat number categories as the numbers of previous incidents increases (see note 4.4).
3.5. Incidents of domestic abuse by age of victim and perpetrator (tables 11a, 11b, 12, 13a and 13b, and chart 3)
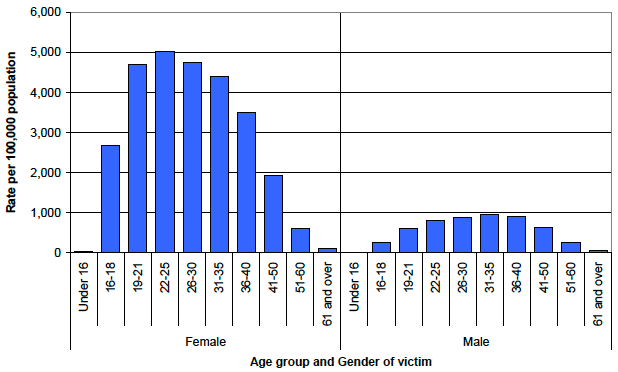
- In 2011-12, the highest rate of incidents of domestic abuse per 100,000 population among female victims was for those aged 22 to 25 years, where the rate was 5,028 incidents per 100,000 population. This is the same age group as in 2010-11, where the rate was 4,939 incidents recorded per 100,000 population.
- Among male victims, the highest rate of incidents of domestic abuse per 100,000 population in 2011-12, was for those aged 31 to 35 years, where the rate was 964 incidents per 100,000 population. This is the same age group as in 2010-11, where the rate was 875 per 100,000 population.
Chart 3 Rate per 100,000 population of incidents of domestic abuse, by age and gender of victim where known, Scotland, 2011-12.
- In 2011-12, the highest rate of incidents of domestic abuse per 100,000 population among female perpetrators was by those aged 26 to 30 years, where the rate was 996 incidents per 100,000 population. This has changed from 2010-11 where the highest rate per 100,000 population of female perpetrators was by those aged 22 to 25 years, at a rate of 978 incidents per 100,000 population.
- Among male perpetrators, the highest rate of incidents of domestic abuse per 100,000 population in 2011-12 was also by those aged 26 to 30 years, where the rate was 4,581 incidents per 100,000 population. This has changed from 2010-11 where the highest rate per 100,000 population of male perpetrators was by those aged 31 to 35 years at a rate of 4,440 incidents per 100,000 population.
3.6. Incidents of domestic abuse by relationship between victim and perpetrator (table 16a, 16b and 17)
- Since 2002-03, the percentage of incidents involving spouses, co-habitees and partners has decreased from 68% to 55% in 2011-12. This has been driven by a decrease in the percentage of incidents involving spouses over this period, from 24% in 2002-03 to 13% in 2011-12.
- In 2011-12, incidents of domestic abuse recorded by the police involving co-habitees or partners accounted for 42% of all incidents where the relationship and gender were recorded, with more cases relating to partners (23%) than co-habitees each (19%).
- In 44% of incidents where the relationship was recorded in 2011-12, the victim and perpetrator were ex-partners or ex-spouses. This figure has been increasing since 2002-03, when 31% of incidents involved ex-partners/ex-spouses. 'Other' relationships include relationships not fitting into specified categories, and incidents where the relationship is unknown.
3.7. Location of incidents of domestic abuse (tables 18a, 18b, 19, 20a and 20b, and chart 4)
- In 87% of incidents in 2011-12 where the location was recorded, domestic abuse took place in a home/house. Where the victim and perpetrator cohabited i.e. were a `spouse' or `co-habitee', 93% of all incidents recorded were in a home/house.
- In all other relationships, excluding those of a 'spouse' or 'co-habitee', 84% of all incidents in 2011-12 (where the relationship and location were recorded) took place in a home/house. This shows that the overwhelming majority of domestic abuse incidents still take place 'behind closed doors'.
Chart 4 Incidents of domestic abuse recorded by the police: location of incident by relationship (where known), Scotland, 2011-12.
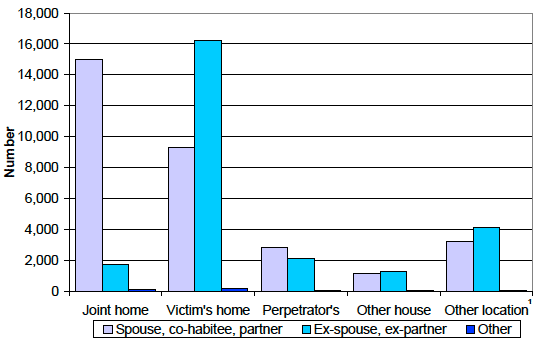
1. Other location includes street and licensed premises.
3.8. Crimes and offences of domestic abuse, action taken by police (tables 1a, 1b, 2, 21a, 21b and 22, and chart 5)
- Where an incident of domestic abuse resulted in a crime or offence being recorded, a report was submitted to the procurator fiscal in 77% of incidents in 2011-12, an increase of 18 percentage points from 2002-03.
Chart 5 Action taken by the police against identified perpetrators of crimes/offences cleared up by the police, by police force area, 2011-12
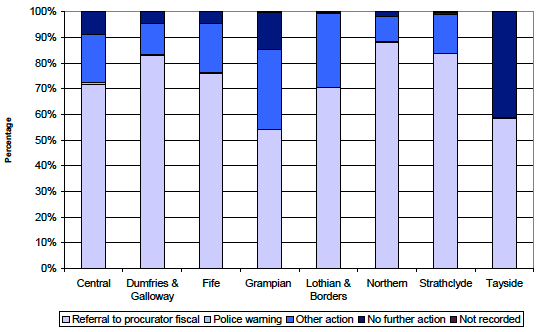
- In 2011-12, where a report was not submitted to the procurator fiscal but the action taken was known, 17% of incidents involved some other type of action and in 5% of incidents no further action was taken.
- In 2011-12, the proportion of crimes and offences of domestic abuse referred to the procurator fiscal varied considerably across police force areas. The percentages ranged from 54% in Grampian, to 88% in Northern. This variation, however, reflects the differences in police practice in recording a crime or offence following an incident of domestic abuse (see note 4.5).
- There was also variation between police forces in the proportion of all incidents of domestic abuse which resulted in referral to the procurator fiscal in 2011-12, ranging from 23% in Lothian & Borders to 53% in Strathclyde.
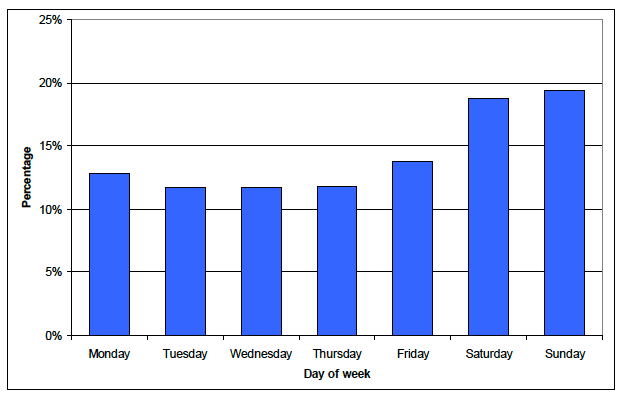
3.9. Day of occurrence of domestic abuse incidents (table 24, chart 6)
- The day of occurrence of incidents of domestic abuse shows that more incidents are recorded at the weekend than during the week. 38% of all incidents of domestic abuse in 2011-12 occurred on a Saturday or a Sunday, with the remaining 62% spread fairly evenly throughout the rest of the week.
Chart 6 Incidents of domestic abuse recorded by the police: day of week incident occurred, Scotland 2011-12.
Contact
Email: Jan Young
There is a problem
Thanks for your feedback