Scottish Sea Fisheries Statistics 2011
A detailed overview of landings of sea fish; the Scottish fishing fleet; and the number of sea fishermen employed.
This document is part of a collection
1. Overview of landings
This chapter brings together information on the quantity, value, species and area of capture of sea fish landings. The focus is on Scottish based vessels and landings into Scotland.
1.1 Landings by Scottish based vessels
In 2011, Scottish based vessels landed 359 thousand tonnes of sea fish and shellfish into the UK and abroad with a value of £501 million ( Table 1.1.e and Chart 1.1.). This represents a two per cent decrease in quantity but a 13 per cent increase in value in real terms compared to 2010. The value of landings represents the highest value in real terms this century. This increase in value continues the trend for increasing value of landings over the previous five years with the exception of 2010 where there was a dip in value obtained for landings. Over the same period quantity of landings increased between 2007 and 2009 before decreasing in 2010 and 2011.
Chart 1.1 Quantity and value of all landings by Scottish vessels: 2007 to 2011.

Landings by Scottish vessels accounted for 60 per cent of the quantity and the value of all landings by UK vessels ( Tables 1.1.e, 1.1.o and 1.1.v).
1.1.1 Demersal, pelagic and shellfish landings by Scottish based vessels
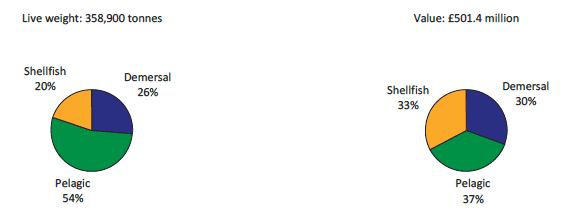
In 2011, pelagic species accounted for 54 per cent of landings by Scottish vessels in terms of quantity and 37 per cent in terms of value. Demersal species represented 26 per cent of landings by quantity and 30 per cent by value, while shellfish accounted for 20 per cent of landings by quantity and 33 per cent by value (Chart 1.2).
Chart 1.2 Quantity and value of landings by Scottish vessels; percentage of each species type, 2011.
The main reason for the increase in the total value of landings by Scottish vessels is due to the 39 per cent increase, in real terms, in the value of pelagic landings from £132.6 million in 2010 to £184.3 million in 2011. Over the same period, the quantity of pelagic landings saw only a small, two per cent increase to 192 thousand tonnes. This increase in value reflects the higher prices being achieved for the main pelagic species, mackerel and herring. The value of shellfish landings also saw an increase in 2011 compared to 2010, although not to the same extent as pelagic landings. At £164.2 million in 2011, the increase was five per cent in real terms from £156.5 million in the previous year, while the quantity of landings remained virtually unchanged over the same period at 72 thousand tonnes. Demersal landings saw a slight decrease of two per cent from £155.8 million to £152.9 million between 2010 and 2011, predominantly as a result of the quantity of landings decreasing by 11 per cent to 95 thousand tonnes.
Chart 1.3 Quantity and value of landings by Scottish vessels by each species type; 2000 to 2011.

A breakdown of landings by Scottish vessels into Scotland, the rest of the UK, and abroad, by species are given in Tables 1.1.a to 1.1.e as well as corresponding figures for other UK vessels in Tables 1.1.f to 1.1.o, and figures for foreign vessels landings into the UK in Tables 1.1.p to 1.1.t.
Demersal fish
Monkfish, haddock and cod are the three main demersal fish landed by Scottish vessels in terms of value of landings, accounting for 57 per cent of all the demersal species landed by Scottish vessels in 2011.
In 2011, landings of monkfish by Scottish vessels remained virtually unchanged compared to 2010, in terms of quantity at 10 thousand tonnes, value (in real terms) at £33.5 million and price at £3,453 per tonne. Landings of haddock by the Scottish fleet at 24 thousand tonnes in 2011 have fallen by 13 per cent compared to 2010, although this was offset by an increase of seven per cent in real terms in the average price of haddock to £1,263 per tonne. This resulted partially in a smaller decrease in value to £30.9 million, which represents a value seven per cent lower in real terms than in the previous year. Cod landings by Scottish vessels were down 15 per cent to 10 thousand tonnes in 2011 compared with the previous year. As with haddock, cod saw an increase in the average price achieved, at £2,215 per tonne 2011 prices were nine per cent higher in real terms than the price obtained in the previous year. The balance of the increase in price and the decrease in value of cod landings meant a seven per cent decrease in value to £22.9 million was observed in 2011.
The improvement in prices observed for cod and haddock are also replicated in the majority of the other key demersal species for Scottish vessels and have contributed to the increase in the value achieved for these species in 2011 compared to 2010. These increases underpin the small decrease in value for demersal landings in 2011 compared to the previous year.
Chart 1.4.a Quantity and value of landings of the key demersal species by Scottish vessels: 2007 to 2011.

Pelagic fish
Mackerel and herring are the two main pelagic fish landed by Scottish vessels in terms of both quantity and value of landings. Together these two species account for 98 per cent of the value and 96 per cent of the quantity of all the pelagic landings by Scottish vessels in 2011. In 2011, the value of landings of both mackerel and herring saw large increases compared to the previous year. At £163.1 million, the value in real terms of mackerel landings had increased 40 per cent from £116.1 million in 2010. This increase in value was achieved by the combination of substantial increases in average prices and increased landed quantity. At £1,118 per tonne, the price obtained in 2011 represents a 30 per increase in real terms compared to prices achieved in 2010 and is a record price. This increase in price continues the trend for increasing mackerel prices over the previous five years with the exception of 2010 where there was a dip in prices. At 146 thousand tonnes the quantity landed was eight per cent higher than the 135 thousand tonnes landed in 2010. As in 2010, mackerel remains the most valuable species to the Scottish fleet. An increase in the value of herring landings was also achieved in 2011, with a value of £17.0 million representing a 42 per cent increase in value in real terms compared to 2010. This increase was achieved despite a 10 per cent decrease in the quantity of herring landings to 38 thousand tonnes and was achieved by the considerable improvements in prices obtained for herring in 2011. At £450 per tonne herring prices in real terms were 57 per cent higher than in 2010.
Chart 1.4.b Quantity and value of landings of the key pelagic species by Scottish vessels: 2007 to 2011.

Shellfish
Nephrops and scallops are the two main species of shellfish landed by Scottish vessels, accounting for 70 per cent of the value and 53 per cent of the quantity landed in 2011. In 2011, landings of Nephrops by Scottish vessels decreased by 16 per cent from 2010 to 23 thousand tonnes. At the same time, the average price of Nephrops landed by Scottish vessels increased by 27 per cent in real terms to £3,721 per tonne. These strong prices led to a real term seven per cent increase in the value of Nephrops landings to £84.3 million despite the decrease in the quantity landed. As in 2010, Nephrops remain the second most valuable species to the Scottish fleet. Scallop landings by Scottish vessels decreased to 16 thousand tonnes in 2011, down 16 per cent from 2010. However, relatively strong average price were obtained for scallops in 2011, with the average price at £1,960 per tonne being 12 per cent higher than the price obtained in the previous year. These strong prices partially offset the decrease in the quantity landed, so the value of landings, at £30.9 million was only six per cent lower than in 2010.
Overall, increases in the quantity of lobster, edible crabs and queen scallops have offset the decrease in quantity of landings of the two main shellfish species such that the quantity of shellfish landings remains unchanged between 2010 and 2011, at 72 thousand tonnes.
Chart 1.4.c Quantity and value of landings of the key shellfish species by Scottish vessels: 2007 to 2011.

1.2 Landings abroad by Scottish based vessels
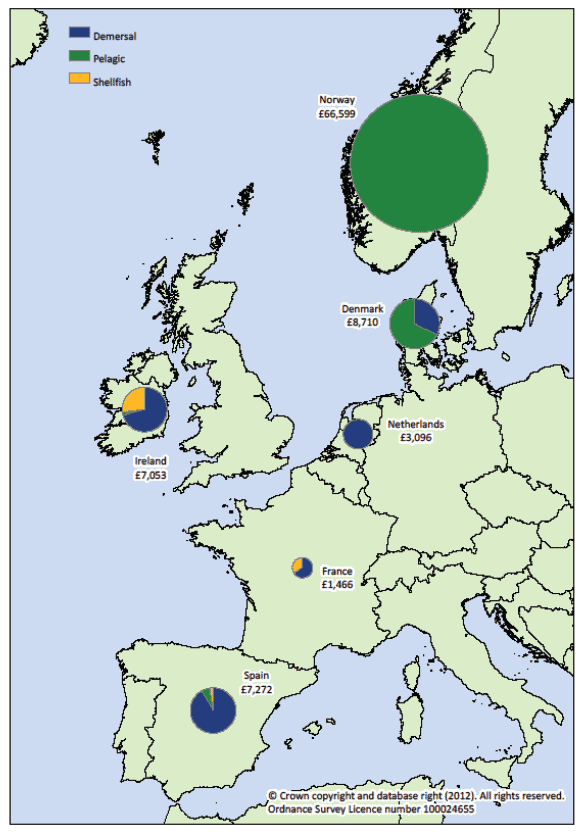
In 2011, Scottish vessels landed 103 thousand tonnes of sea fish and shellfish abroad with a value of £96.7 million. This represents 29 per cent in quantity and 19 per cent in value of all landings by Scottish vessels. Norway receives the majority of these landings abroad, with 72 thousand tonnes at £66.6 million, which represents 70 per cent in quantity of all landings abroad by Scottish vessels and 69 per cent in value. Denmark, Spain and Ireland are the other key countries that receive landings from Scottish vessels. Combined, these three countries account for a further 24 per cent of the total value of landings abroad by Scottish vessels.
Over three quarters of the fish landed abroad by Scottish vessels in terms of value were pelagic (mainly mackerel) and 19 per cent were demersal. Shellfish constitute less than five per cent of the value of landings abroad. The majority of pelagic species landed abroad are landed into Norway, with Spain, Ireland and Denmark being key countries for demersal landings. Ireland receives the majority of shellfish species landed abroad by Scottish vessels.
Figure 1.1.a Quantity of landings abroad by Scottish vessels by country of landing: 2011 (tonnes).
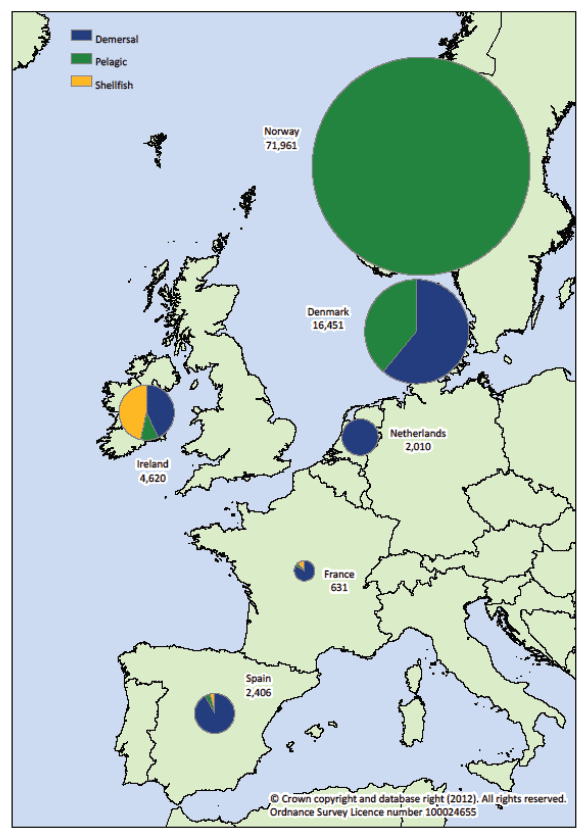
Figure 1.1.b Value of landings abroad by Scottish vessels by country of landing: 2011 (£' thousands).
1.3. Landings by area of capture
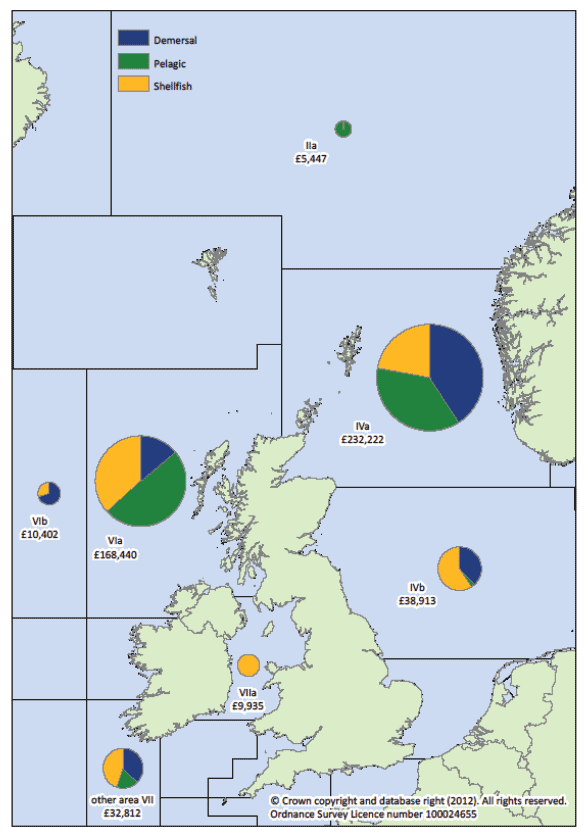
The quantity of fish landed by Scottish vessels caught from the Northern North Sea ( ICES division IVa) or the West of Scotland ( ICES division VIa) each represented over a quarter of all fish landed, with 140 tonnes worth £232.2 million and 134 tonnes worth £168.4 million, landed from the Northern North Sea and West of Scotland, respectively.
Landings from the Northern North Sea provide over a half of the total quantity of demersal fish landed by the Scottish fleet, while the Central North Sea ( ICES division VIb) and the West of Scotland provide 17 per cent and 14 per cent of the total quantity of demersal landings. Pelagic species are mainly caught in the West of Scotland, with landings accounting for half of the total quantity of pelagic fish landed by the Scottish fleet, and landings from the Northern North Sea representing over a third of the total quantity of pelagic fish landings. Over a third of shellfish landings are from the West of Scotland, and just under a quarter of landings are made from the Northern North Sea and also from the Irish Sea ( ICES division VIIa). Ten per cent of shellfish landings were made from the central North Sea and also the rest of ICES area VII.
Further maps of fishing activity in the seas around the UK by Scottish vessels, other UK vessels, and foreign vessels that land into the UK are available on the ICES rectangle webpage on the Scottish Sea Fisheries Statistics website. These maps show the quantity and value of landings by species type by ICES rectangle.
Figure 1.2.a Quantity of landings by Scottish vessels by area of capture: 2011 (tonnes).
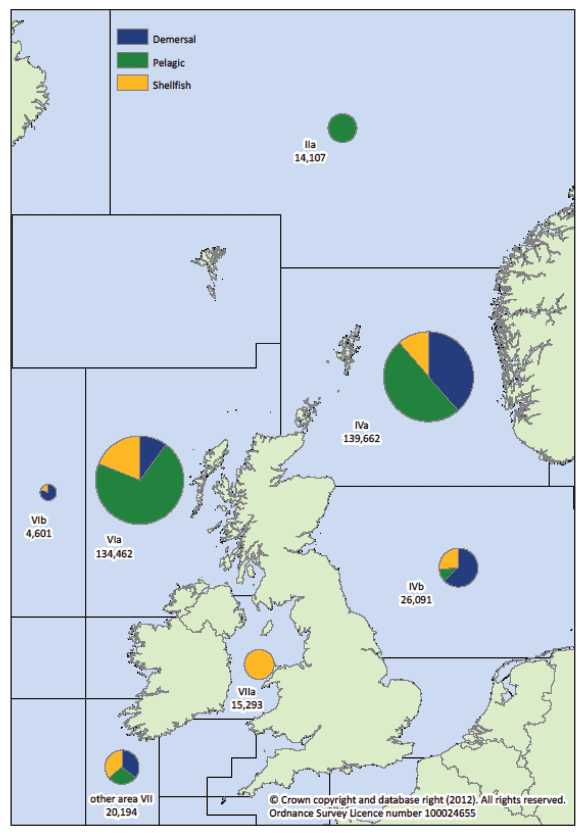
Figure 1.2.b Value of landings by Scottish vessels by area of capture: 2011 (£'thousand).
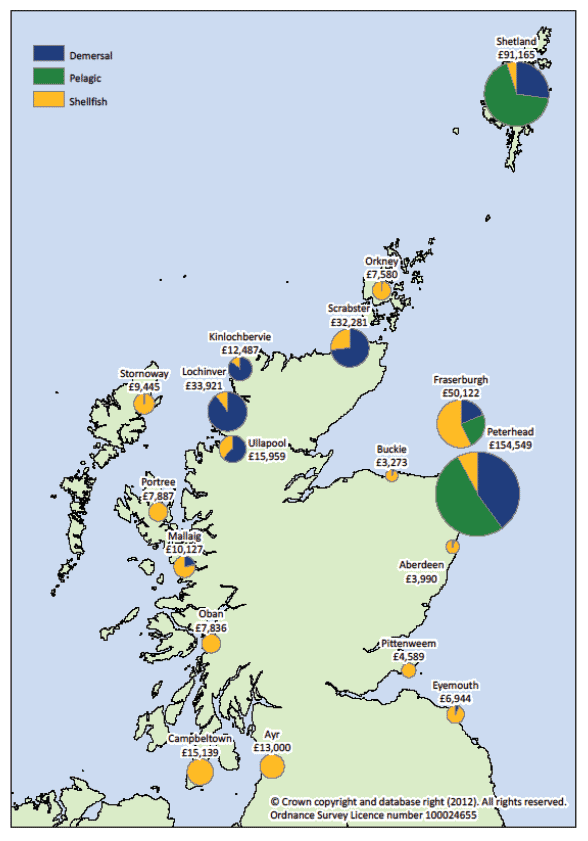
In 2011, there was 316 thousand tonnes of sea fish and shellfish landed into Scotland with a value of £480 million. This represents a 17 per cent decrease in quantity but a seven per cent increase in value compared to 2010. The proportion each species type contributes to the total value of all landings into Scotland is relatively similar at 36 per cent for demersal species and 32 per cent for pelagic and shellfish species. In contrast, the proportion each species type contributes to the total quantity of landings is quite different between the species types with shellfish species accounting for 19 per cent of the total quantity while demeral species make up 33 per cent and pelagic species 48 per cent of the total quantity. This highlights the difference between the average price per tonne across the species types. Figure 1.3.a and b shows landings by species type into the eighteen Scottish districts. Landings into the south west coast are dominated by shellfish while landings into the north west coast constitute mainly demersal and shellfish species. Landings into the east coast are dominated by the top three districts; Peterhead, Shetland and Fraserburgh that receive landings of all the species types (though Shetland and Peterhead see relatively little shellfish). Landings into the other east coast districts are dominated by shellfish and a small quantity and value of demersal species.
Combined the top three districts account for 71 per cent in quantity and 62 per cent in value of all landings into Scotland. One hundred and twenty eight thousand tonnes worth £154.5 million was landed into Peterhead, of this pelagic species accounted for 52 per cent in value and demersal species represented 40 per cent, with shellfish contributing less than ten per cent of the total value landed into this district. Landings into Shetland totalled 71 thousand tonnes at a value of £91.1 million. As with Peterhead, the majority of landings into Shetland were of pelagic species, these species represented 68 per cent of the total value of landings into Shetland while demersal species accounted for 27 per cent, with shellfish contributing less than ten per cent of the total value of landings. In contrast, landings into Fraserburgh were dominated by shellfish which accounted for 57 per cent of the £50.1 million total landings into this district.
Figure 1.3.a Quantity of landings into Scotland by Scottish vessels by district: 2011 (tonnes).
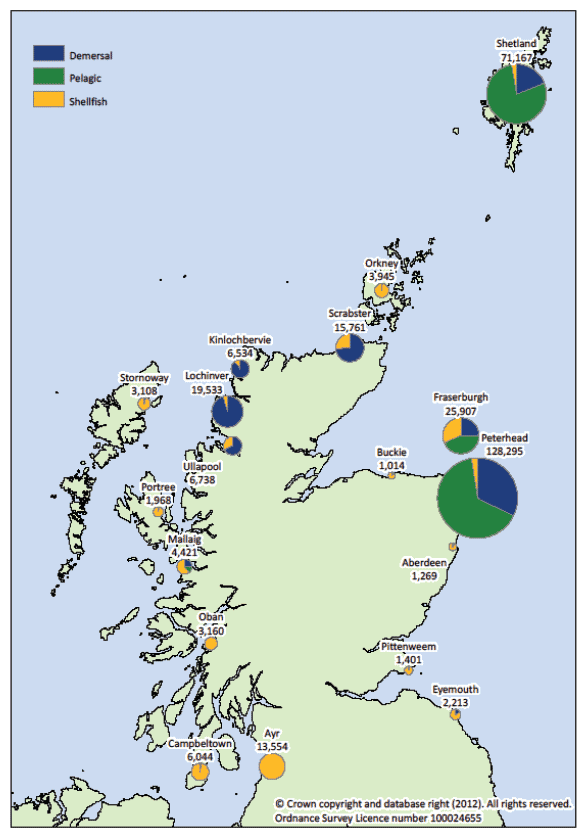
Figure 1.3.b Value of landings into Scotland by Scottish vessels by district: 2011 (£'thousand).
1.5 Total allowable catches, quota and uptake
Table 1.10 shows the total allowable catch ( TAC) which is a catch limit set by the European Commission for individual stocks. TACs are fixed on an annual basis at negotiations held by EU member states. A share of the EU TAC is allocated to EU member states based on a number of factors, including the member state's past catch record. This share, known as quota, is displayed in Table 1.10 at the UK and, for the first time, at the Scottish Producers Organisations ( POs) level. The quantity and percentage uptake of this quota is also given for each stock in Table 1.10.
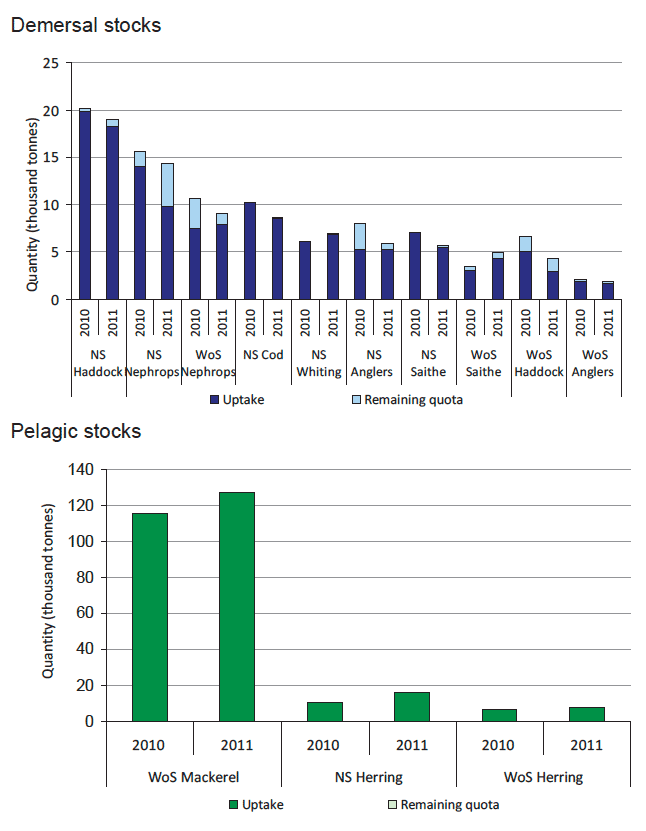
In 2011, of the demersal stocks of importance to Scottish vessels, landings of North Sea Haddock, North Sea Cod, North Sea Whiting, and North Sea Saithe nearly exhausted the quota available, as displayed in Chart 1.5. Quota uptake for the important pelagic stocks was exhausted for North Sea Herring and slightly exceeded the quota allocation for West of Scotland Mackerel and West of Scotland Herring.
Chart 1.5 Quota uptake of important stocks by vessels in Scottish POs in 2010 and 2011.
Contact
There is a problem
Thanks for your feedback