Mental Health Officers(MHO) survey, Scotland 2011-12
This survey collects information about the number of qualified MHOs who are practising within Scotland.
5. Work undertaken by MHOs
This section of the report looks at the work specifically undertaken by a MHO.
5.1 Rota Duty
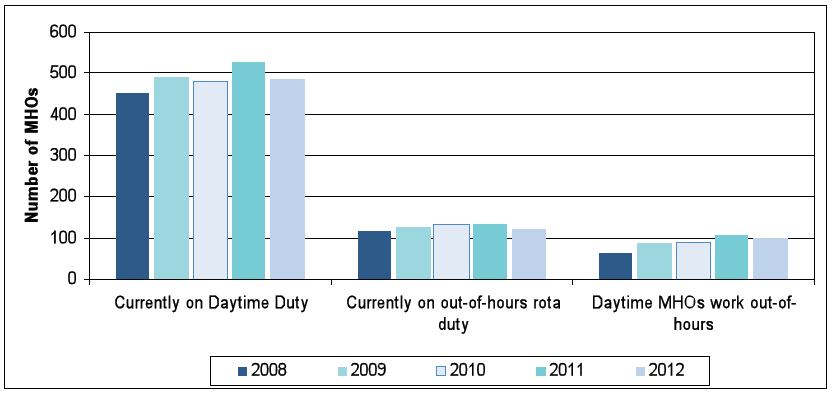
Table 19 shows that the number of MHOs on daytime rota duty has decreased from 529 in 2011 to 490 in 2012, a decrease of 7.4%. However, this figure is higher than 2008 levels and similar to that sent in 2009 & 2010.
The number of MHOs on out-of-hours rota duty has been increasing year on year since 2008, however this year it decreased to 123 MHOs worked on the out-of-hours rota from 137 in 2011. In 2012, 103 daytime MHOs worked on the out-of-hours rota a slight decease from 2011 but still 61% higher than 2008.
Figure 9: Number of MHOs on rota duties, 2008 to 2012

Table 19: Number of MHOs on rota duties, 2008 to 2012
| 2008 | 2009 | 2010 | 2011 | 2012 | |
|---|---|---|---|---|---|
| Currently on Daytime Duty | 455 | 492 | 481 | 529 | 490 |
| Currently on out-of-hours rota duty | 116 | 127 | 132 | 137 | 123 |
| Daytime MHOs work out-of-hours | 64 | 89 | 89 | 108 | 103 |
5.2 Mentally disordered offender (MDO) work undertaken by MHOs
This section of the report examines the specific types of work undertaken by MHOs in relation to mentally disordered offenders (MDO). This question has been in the survey since 2007 and it asks about three specific types of MDO work:
- Assessment & Treatment Orders
- Compulsion Orders
- Designated MHO for a restricted patient
It is possible that a MHO will not be involved in any MDO work or that they may work on more than one type of work during the year, this will depend on the size of a Local Authority and the number of offenders in a year.
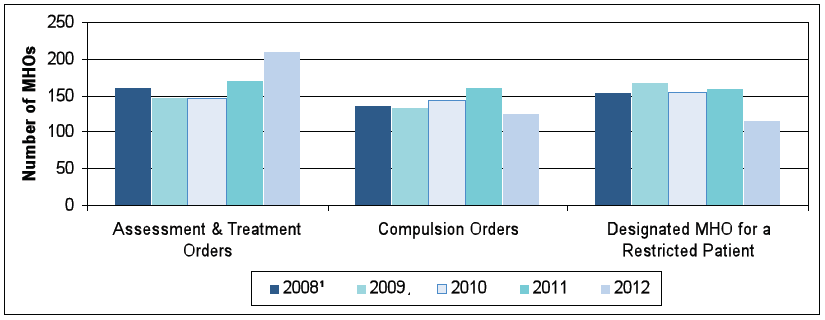
The number of MHOs undertaking assessment & treatment orders shown in Table 20 has increased from 171 in 2011 to 210 in 2012. Table 20 also shows that there were 138 MHOs working on compulsion orders in 2008, this decreased in 2009 to 134. In 2011 the number of MHO's working on compulsion orders had increased to 161, but this has decreased in 2012 to 125. The number of MHOs who are the designated officer for a restricted patient has decreased by 26.4%, from 159 in 2011 to 117 in 2012.
Figure 10: Number of MHOs undertaking MDO work by work type, 2008 to 2012

1Not every Local Authority was able to provide a response by specific work types.
Table 20: Number of MHOs undertaking MDO work by work type, 2008 to 2012
| Number of MHO's undertaking work | |||||
|---|---|---|---|---|---|
| Work area's undertaken by MHO's | 20081 | 2009 | 2010 | 2011 | 2012 |
| Assessment & Treatment Orders | 161 | 147 | 146 | 171 | 210 |
| Compulsion Orders | 138 | 134 | 144 | 161 | 125 |
| Designated MHO for a Restricted Patient | 154 | 168 | 154 | 159 | 117 |
1Not every Local Authority was able to provide a response by specific work types.
The figures in Table 21 show that the majority of MDO cases are undertaken by MHOs on specialist MH teams, this was 81.8% in 2008 and remained at a similar level in 2009. In 2010 this decreased substantially to 73.0%, before rising to 78.2% on 2011 before falling again in 2012 to 68.7%.
Table 21: Number of MHOs undertaking MDO work by MH team, 2008 to 2012
| MHO Numbers | Percentage of yearly total | |||||||||
|---|---|---|---|---|---|---|---|---|---|---|
| 2008 | 2009 | 2010 | 2011 | 2012 | 2008 | 2009 | 2010 | 2011 | 2012 | |
| Specialist teams | 229 | 173 | 176 | 204 | 180 | 81.8% | 81.6% | 73.0% | 78.2% | 68.7% |
| Non-specialist teams | 51 | 39 | 65 | 57 | 82 | 18.2% | 18.4% | 27.0% | 21.8% | 31.3% |
| Total | 280 | 212 | 241 | 261 | 262 | 100.0% | 100.0% | 100.0% | 100.0% | 100.0% |
Contact
Email: Jonathan Glassford
There is a problem
Thanks for your feedback