Mental Health Officers(MHO) survey, Scotland 2011-12
This survey collects information about the number of qualified MHOs who are practising within Scotland.
3. MHO workforce
Since 2005, the Scottish Executive has collected information on the MHO workforce within each Local Authority. This report presents figures for the last five years. All figures relate to practicing MHOs in post at the 31st March for a given year.
3.1 MHO numbers over time
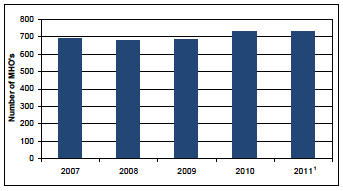
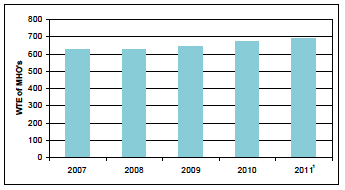
Table 1 shows that on the 31st March 2012 there were 688 MHOs practicing this is a decrease of 5.5% from 2011. The staffing whole time equivalent (WTE) on the 31st March 2012 was 635.44, this is a decrease of 7.6% from 2011. The average WTE per MHO has decreased by 2.1% from 0.94 in 2011 to 0.92 in 2012.
Figure 1: Number of MHOs, 2008 to 2012

Figure 2: WTE of MHOs, 2008 to 2012

Table 1: Practicing MHOs, 2008 to 2012
| 2008 | 2009 | 2010 | 2011 | 2012 | |
|---|---|---|---|---|---|
| Number of MHO's | 674 | 682 | 726 | 728 | 688 |
| WTE of MHO's | 622.16 | 643.04 | 667.84 | 687.75 | 635.44 |
| Average WTE per person | 0.92 | 0.94 | 0.92 | 0.94 | 0.92 |
The MHO workforce is split between specialist or non-specialist Mental Health (MH) teams. Table 2 shows that in 2008 52% of MHOs worked in specialist MH teams with the number increasing by 2% to 54% in 2009 before falling back to 52% in 2010. In 2011 this increased to 53% and has increased further in 2012 to 56%. Section 4 of this report looks at the field team on which a MHO works in more detail.
Table 2: MHOs by type of Mental Health team, 2008 to 2012
| 2008 | 2009 | 2010 | 2011 | 2012 | |
|---|---|---|---|---|---|
| Specialist MH teams | 352 | 366 | 381 | 383 | 384 |
| Non-specialist MH teams | 322 | 316 | 345 | 345 | 304 |
| Percentage in Specialists MH teams | 52% | 54% | 52% | 53% | 56% |
3.2 MHO rates per 1,000 of population
Table 3 shows that the rate of MHOs per 1,000 of the Scottish population has remained constant at between 0.12 and 0.13 between 2007 and 2012, with it currently at 0.12 in 2012. (Refer to Annex 1).
Table 3: MHOs rates, 2008 to 2012
| 2008 | 2009 | 2010 | 2011 | 2012 | |
|---|---|---|---|---|---|
| MHO WTE rate per 1,000 of the Scottish population | 0.12 | 0.12 | 0.13 | 0.13 | 0.12 |
Source : NRS mid-year population estimates 2007 to 2011.
3.3 Age and gender of MHO workforce
A question regarding the age and gender of an MHO was first introduced in the 2007 survey. A MHOs age and gender can only be provided with their consent, which has resulted in incomplete returns. This means that the figures for each year are not comparable and the figures will not sum to the total number of MHOs due to missing information. (Table 4)
Table 4: Undisclosed MHO age and gender data, 2008 to 2012
| 2008 | 2009 | 2010 | 2011 | 2012 | |
|---|---|---|---|---|---|
| Undisclosed data | 3 | 102 | 0 | 28 | 94 |
The MHO workforce at 31st March 2012 had 418 (70.3%) female and 176 (29.7%) male MHOs. Looking specifically at the ages of the MHO workforce in 2012, the majority (72.6%) of MHO workforce were aged 45 and over. A higher percentage of males (77.8%) were aged 45 and over compare to females (70.3%). The age grouping with the highest percentage of MHOs is 50-54 for males at 24.4% and 55-59 for females at 23%.
Figure 3: Age and gender of MHO workforce, 2012

Table 5: Male MHOs by Age group, 2008 to 2012
| Age group | Male - Numbers | Male - Percentage | ||||||||
|---|---|---|---|---|---|---|---|---|---|---|
| 2008 | 2009 | 2010 | 2011 | 2012 | 2008 | 2009 | 2010 | 2011 | 2012 | |
| Under 39 | 26 | 16 | 15 | 15 | 12 | 11.6% | 8.9% | 6.6% | 6.6% | 6.8% |
| 40-44 | 35 | 28 | 37 | 44 | 27 | 15.6% | 15.6% | 16.2% | 19.3% | 15.3% |
| 45-49 | 39 | 36 | 46 | 48 | 41 | 17.4% | 20.0% | 20.2% | 21.1% | 23.3% |
| 50-54 | 65 | 47 | 54 | 51 | 43 | 29.0% | 26.1% | 23.7% | 22.4% | 24.4% |
| 55-59 | 46 | 39 | 49 | 42 | 35 | 20.5% | 21.7% | 21.5% | 18.4% | 19.9% |
| 60+ | 13 | 14 | 27 | 28 | 18 | 5.8% | 7.8% | 11.8% | 12.3% | 10.2% |
| Totals | 224 | 180 | 228 | 228 | 176 | 100.0% | 100.0% | 100.0% | 100.0% | 100.0% |
Figures for each year are not comparable.
Table 6: Female MHOs by Age group, 2008 to 2012
| Age group | Female - Numbers | Female - Percentage | ||||||||
|---|---|---|---|---|---|---|---|---|---|---|
| 2008 | 2009 | 2010 | 2011 | 2012 | 2008 | 2009 | 2010 | 2011 | 2012 | |
| Under 39 | 82 | 55 | 79 | 77 | 61 | 18.3% | 13.8% | 15.9% | 15.4% | 14.6% |
| 40-44 | 60 | 57 | 69 | 79 | 63 | 13.4% | 14.3% | 13.9% | 15.8% | 15.1% |
| 45-49 | 88 | 77 | 89 | 82 | 73 | 19.7% | 19.3% | 17.9% | 16.4% | 17.5% |
| 50-54 | 100 | 83 | 120 | 113 | 85 | 22.4% | 20.8% | 24.1% | 22.6% | 20.3% |
| 55-59 | 97 | 102 | 101 | 107 | 96 | 21.7% | 25.5% | 20.3% | 21.4% | 23.0% |
| 60+ | 20 | 26 | 40 | 42 | 40 | 4.5% | 6.5% | 8.0% | 8.4% | 9.6% |
| Totals | 447 | 400 | 498 | 500 | 418 | 100.0% | 100.0% | 100.0% | 100.0% | 100.0% |
Figures for each year are not comparable.
3.4 Ethnicity of the MHO workforce
An ethnicity question was first introduced to the survey in 2008 and as with the age and gender question a MHOs ethnicity can only be provided with their consent.
Table 7 shows that 0.6% of the MHO workforce are from an ethnic minority. However, 12.8% of all staff had either not wanted to disclose or not known their ethnic group this is a increase when compared with 2011 of 9.2%. The majority of MHOs not wanting to disclose their ethnicity are from one Local Authority.
Table 7: Ethnicity of MHOs, 2008 to 2012
| Number of MHOs | Percentage of yearly total | |||||||||
|---|---|---|---|---|---|---|---|---|---|---|
| Ethnicity | 2008 | 2009 | 2010 | 2011 | 2012 | 2008 | 2009 | 2010 | 2011 | 2012 |
| White | 550 | 598 | 700 | 656 | 596 | 81.6% | 87.7% | 96.4% | 90.1% | 86.6% |
| Minority | 5 | 6 | 7 | 5 | 4 | 0.7% | 0.9% | 1.0% | 0.7% | 0.6% |
| Not Known / Not Disclosed | 119 | 78 | 19 | 67 | 88 | 17.7% | 11.4% | 2.6% | 9.2% | 12.8% |
| Total | 674 | 682 | 726 | 728 | 688 | 100.0% | 100.0% | 100.0% | 100.0% | 100.0% |
Figures for each year are not comparable.
3.5 Number of trainee MHOs
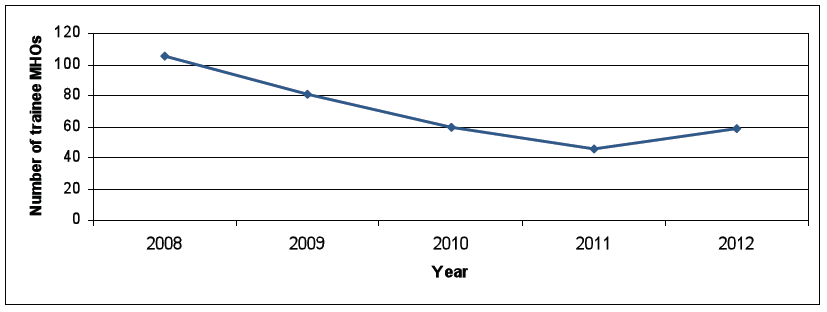
The number of trainee MHOs has increased from 46 in 2011 to 59 in 2012 but there is still a substantial decrease from 105 MHOs in 2008.
Figure 4: Number of trainee MHOs, 2008 to 2012

Table 8: Trainee MHO numbers, 2008 to 2012
| 2008 | 2009 | 2010 | 2011 | 2012 | |
|---|---|---|---|---|---|
| Number of trainee MHO | 105 | 81 | 60 | 46 | 59 |
3.6 MHOs leaving the workforce
A new question was added to the 2009 survey to collect the number of MHOs leaving the workforce and the reason for leaving. During 2011/12 a total of 90 MHOs left the workforce, this figure is substantially higher than reported in the past three years of 51 (refer to Table 9).
The reason for given for a MHO leaving the workforce, has changed considerable since 2009. In 2009 the most common reason was due to a change of post (promotion), this is now one of the least reported reasons in 2012. Table 9 shows that the most common reason for MHOs leaving the workforce in 2012 is due to a retirement (33.3%), closely followed by change of post (22.2%).
Table 9: Number of MHOs leaving the workforce, 2009 to 2012
| Number of MHOs | Percentage of yearly total | |||||||
|---|---|---|---|---|---|---|---|---|
| 2009 | 2010 | 2011 | 2012 | 2009 | 2010 | 2011 | 2012 | |
| Change of post (Promotion) | 10 | 3 | 6 | 4 | 19.6% | 5.9% | 11.8% | 4.4% |
| Change of post (Sideways move) | 9 | 3 | 2 | 20 | 17.6% | 5.9% | 3.9% | 22.2% |
| Resigned | 9 | 15 | 14 | 17 | 17.6% | 29.4% | 27.5% | 18.9% |
| Retired | 8 | 18 | 22 | 30 | 15.7% | 35.3% | 43.1% | 33.3% |
| Career Break | 8 | 4 | 1 | 2 | 15.7% | 7.8% | 2.0% | 2.2% |
| Other (Secondments etc) | 7 | 8 | 6 | 17 | 13.7% | 15.7% | 11.8% | 18.9% |
| Total | 51 | 51 | 51 | 90 | 100.0% | 100.0% | 100.0% | 100.0% |
3.7 Number of MHOs vacancies
A question asking about MHO vacancies was first introduced to the survey in 2007. Table 10 shows that the number of unfilled "exclusive" MHO vacancies has increased from 12.3 in 2011 to 16 in 2012, an increase of 30%. In 2012 there were also 25 qualified MHOs unavailable compared to 21 in 2011. A MHO is classed as unavailable when they are either on maternity leave, a career break, on long term sick leave or compassionate leave, for a period of 3 months or more.
Table 10: Currently unfilled MHO posts, 2008 to 2012
| 2008 | 2009 | 2010 | 2011 | 2012 | |
|---|---|---|---|---|---|
| Unfilled "exclusive" MHO vacancies | 21.0 | 12.5 | 9.6 | 12.3 | 16 |
| MHOs currently unavailable | 26 | 18 | 26 | 21 | 25 |
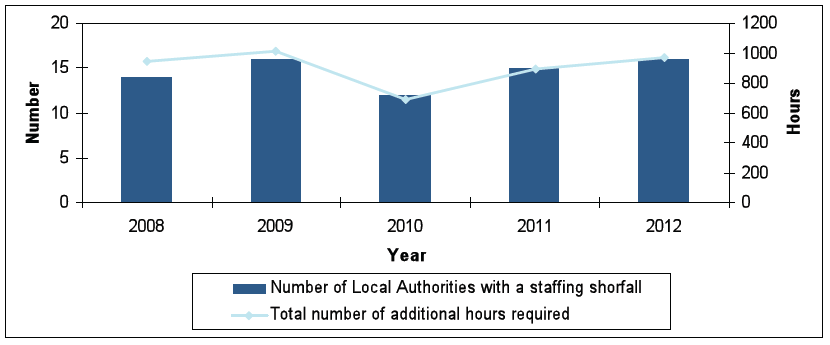
Table 11 presents data on the total shortfall of MHO staff within Scotland. Local Authorities were asked to report any gap between real available time and what they felt was needed within their Authority. The number of Local Authorities reporting a shortfall has increased from 15 in 2011 to 16 in 2012, and the hours required has also increased from 893.5 in 2011 to 967 in 2012.
Table 11: MHO staffing shortfall, 2008 to 2012
| 2008 | 2009 | 2010 | 2011 | 2012 | |
|---|---|---|---|---|---|
| Number of Local Authorities with a staffing shortfall | 14 | 16 | 12 | 15 | 16 |
| Total number of additional hours required | 948.38 | 1008.60 | 690.00 | 893.50 | 967.00 |
| Average shortfall in hours | 67.74 | 63.04 | 57.50 | 59.57 | 60.44 |
Figure 5: MHO staffing shortfall, 2008 to 2012

Contact
Email: Jonathan Glassford
There is a problem
Thanks for your feedback