Scottish Survey of Literacy and Numeracy 2011
The results of the 2011 Scottish Survey of Literacy and Numeracy (SSLN) which focused on numeracy.
Chapter 3: Pupil questionnaire
All pupils participating in the SSLN were asked to complete a questionnaire. The questionnaire focused on factors that are likely to affect learning, such as pupil attitudes and experiences in class.
As with all sample surveys, there are margins of error around the results. The size of these vary but, for example, the first statistic mentioned below (62 per cent in P4 for "listen to the teacher talk to the class…") has a 95 per cent confidence interval of ± 2.1 per cent. Standard error data for these calculations are provided in the data tables. Results are weighted to account for different school sizes, the small number of non-participating schools and gender and deprivation differences between the sample and the population. "Don't know" responses were generally excluded.
3.1 Activities in school
Pupils were asked how often they participate in a range of activities in their class. Full results are available in the data tables. The activities in which the highest percentage of pupils reported they participated "very often" were "listen to the teacher talk to the class about a topic" (62 per cent in P4 and 64 per cent in both P7 and S2) and "work on your own" (between 55 and 61 per cent).
Pupils were also asked about their teachers' practices. The most commonly reported teaching practices being undertaken "very often" were "tell you what you are going to learn before you start" (89 per cent in P7) and "encourage you to work hard" (84 per cent in P7). Fairly similar proportions of pupils reported that teachers go too slowly as too fast - about ten per cent reporting that teachers did this "very often" in each case.
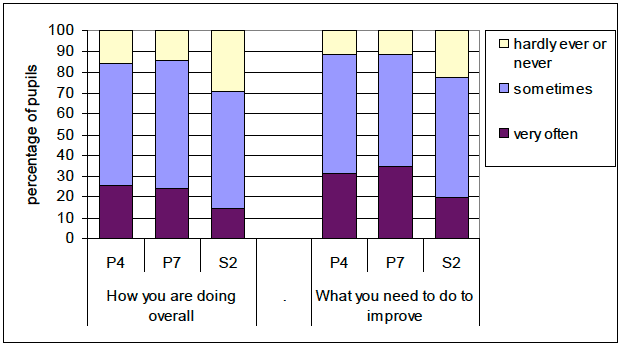
Pupils were also asked how often someone in school talked with them about their learning. The chart below illustrates the results. Over a quarter of pupils in primary stages reported that they received feedback on performance and improvement "very often", but this reduced in secondary.
Chart 3.1: How often does someone in school (e.g. class teacher/head teacher) talk with you about…?
3.2 Attitudes to learning
Pupils were asked a series of questions about their attitude towards learning in general, including how much they enjoy it, what use they think it is, and whether they think they are good at learning.
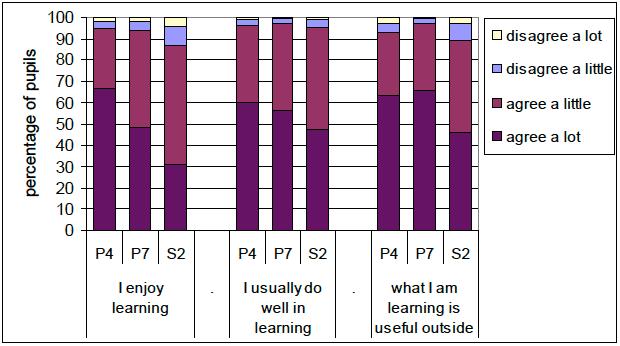
Full results are provided in the data tables, but chart 3.2 illustrates the answers to three of the questions. Enjoyment of learning remained very high throughout the survey stages, though the strength of this agreement reduced in P7 and further in S2. The proportion of pupils reporting that they usually did well remained steady, with just over a half agreeing "a lot" and most others agreeing "a little". Over 60 per cent of P4 and P7 pupils and over 45 per cent of S2 agreed "a lot" that what they were learning would be useful to them outside school. This rises to around 90 per cent if pupils agreeing "a little" are also included.
Chart 3.2: How much do you agree with the following…?
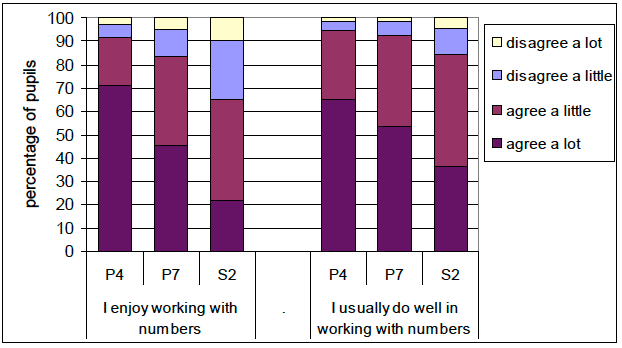
Pupils were also asked about their attitude towards working with numbers. Again full results are available in the data tables, but chart 3.3 illustrates similar patterns to learning in general, but with slightly lower levels of enjoyment and confidence.
Chart 3.3: How much do you agree with the following…?
Pupils were also asked about how good they thought they were in each of the different areas within numeracy. The following chart shows the proportion answering "very good" or "good". The subjects are ordered according to performance at P7. Ideas of chance & uncertainty and fractions, decimal fractions & percentages were consistently reported as the areas where fewest pupils thought they were good, while time and money were generally the most favoured.
Chart 3.4: How good do you think you are at the following…? Percentage saying "good" or "very good", sorted by P7.
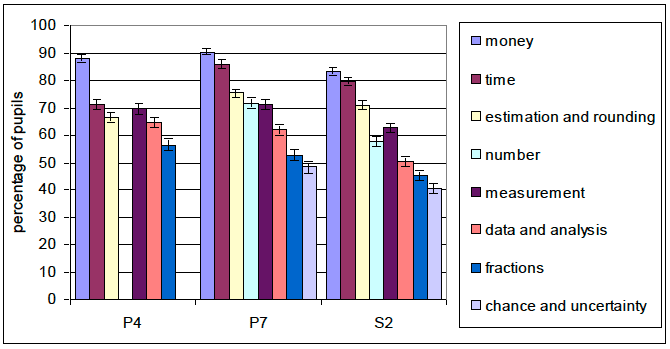
P4 pupils were not asked about ideas of chance & uncertainty and were asked about the four number operators (addition, subtraction, multiplication and division) separately.
3.3 Activities outwith school
Pupils also reported on their activities outwith school. Around 30 per cent of pupils at each stage were involved in a group or club in the area where they live. Between 49 per cent (P4) and 78 per cent (S2) use the internet "very often", while between 40 and 50 per cent of pupils play a musical instrument at least sometimes. Homework was reported as being done "very often" by higher proportions of P4s than S2s, though this may be due to different expectations of what is considered "very often" by pupils in each of these stages.
3.4 Links between attitudes and attainment
As in many other surveys, the SSLN results showed evidence of a strong linkage between attitudes to learning and performance. When pupils enjoy work they tend to work better, which then makes work more enjoyable - a virtuous circle.
To show these links, indices can be created from the three different groups of attitudinal questions. The indices created cover engagement, confidence, and views on usefulness. These indices take the form of a combined score for each group of attitudinal questions, with pupil scores for each reflecting their attitude across the range of questions included within each index. Chart 3.5 illustrates the link between the engagement index (covering five questions on attitude to learning in general) and performance. The biggest drop in pupil performance as engagement level decreased was in S2.
Chart 3.5: Percentage performing "well" or "very well", by index of engagement and stage.
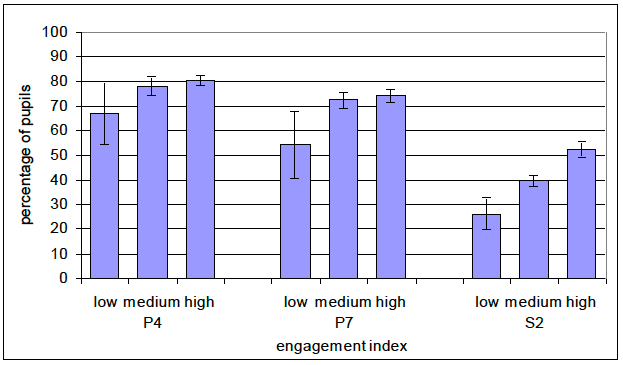
Please see data tables for further details on the calculation of the engagement index.
Overall the drop in performance in S2 is reflected in pupils' views of how good they are (see Chart 3.3). The results showed some evidence of a difference between pupils' views of their performance in the different areas of numeracy and their actual performance. To illustrate this, the following chart shows the difference, in order of decreasing size, between the proportion of correct answers in each area and the proportion of pupils saying they thought they were "good" or "very good" in that area. We would not expect these values to be equal, but the relative differences may be of interest. For example, in each stage pupils performed considerably better in data & analysis than they thought. Primary school pupils also generally performed better in chance and uncertainly than their levels of confidence, or those of their teachers (see Chart 4.1), might predict.
Chart 3.6: Difference in order of scale between percentage of correct answers and percentage of pupils saying they thought they were "good" or "very good", by topic.
| P4 | P7 | S2 | |||
|---|---|---|---|---|---|
| view | performance | view | performance | view | performance |
| money | data and analysis | money | data and analysis | money | number |
| number | money | time | chance and uncertainty | time | data and analysis |
| time | time | estimation and rounding | time | estimation and rounding | money |
| measurement | number | number | money | measurement | time |
| estimation and rounding | measurement | measurement | number | number | fractions |
| data and analysis | estimation and rounding | data and analysis | estimation and rounding | data and analysis | estimation and rounding |
| fractions | fractions | fractions | fractions | fractions | chance and uncertainty |
| chance and uncertainty | measurement | chance and uncertainty | measurement |
Contact
Email: Marion MacRury
There is a problem
Thanks for your feedback