Scotland's seas: towards understanding their state
Scotland's seas: towards understanding their state.
Chapter 5 Productive Seas
INTRODUCTION
The seas around Scotland support a wide range of human activity most of which has an economic value. The productive seas part of the Scottish Government's vision is to recognise this activity, through its value to the economy and its associated employment whilst also recognising any associated impacts the activity might have on the state of the seas. In short, there is the overall aim of using the seas sustainably.
There are a number of questions that can be asked:
- Are our seas being used productively? To answer this requires data about the actual levels of production or activity and possible assessment of these against targets based upon assessments of potential production. Such data are mostly collected by government with often more detailed data available from industry.
- Are our seas being used sustainably? This requires a detailed knowledge of the amount of the resource, its rate of consumption compared with its rate of renewal (if any) and the environmental effects of its use. Overall, levels of a resource are not always known, whilst rate of consumption is covered by statistics about industrial and other types of production. The effects of such use on the environment are sometimes covered by monitoring programmes but not for all uses.
- What is the value of the seas to the economy? Economic value by industry (in the form of Gross Domestic Product ( GDP) at basic prices) is published by the Scottish Government in the Input-Output tables (1) which are compiled using the European System of Accounts (1995); see The Input-Output Approach section. This Input-Approach framework covers all economic activity in Scotland and uses Standard Industrial Classification ( SIC03) codes to detail 128 different industry groups across the whole of the Scottish economy. The tables represent the most detailed cash value GDP breakdowns that are available.
The Input-Output tables also provide detailed information about the flows of products and services between industries. Using this information it is possible to identify industries in other areas of the economy that supply those industries that rely on the sea, as well as industries that buy products from the industries that rely on the sea and add further economic value.
Further to the Input-Output approach to estimating the economic value of specific industries, some industries undertake their own detailed studies to estimate the wider economic contribution of their industry and often include all other linked industrial activity, which can overstate the economic value. As such, Input-Output figures are often lower than specific industry studies.
This report presents an initial analysis from both approaches, first of the Input-Output analysis and, in the sections that follow, more descriptive information about the main marine industries in Scotland, which may include some figures that do not necessarily compare exactly. Data are presented in these two ways to build up an initial evidence base as an overview of marine and marine related activity. A detailed analysis is required to have a full picture. Similarly, a fully integrated assessment of the seas requires the evidence base for both the economic benefits and environmental impacts of the activities. Such an assessment would integrate data from across all parts of a report such as this. It is hoped that the State of Scotland's Seas 2010 can move towards a more complete assessment.
Understanding the impacts of human activities in an ecosystem context will be integral to future marine assessments. Some of the emerging descriptors of good environmental status ( GES) from the Marine Strategy Framework Directive ( MSFD) will be helpful. The relevant ones are shown in Table 5.1.
Table 5.1 Qualitative MSFDGES descriptors for productive seas
MSFD Annex I GES descriptor |
|---|
GES Descriptor 3 - Populations of all commercially exploited fish and shellfish are within safe biological limits, exhibiting a population age and size distribution that is indicative of a healthy stock |
GES Descriptor 6 - Sea-floor integrity is at a level that ensures that the structure and functions of the ecosystems are safeguarded and benthic ecosystems, in particular, are not adversely affected |
GES Descriptor 7 - Permanent alteration of hydrographical conditions does not adversely affect marine ecosystems |
The MSFD also states the need to have productive seas that are managed sustainably. Thresholds of "what level of activity represents sustainability" or "what is considered an adequate level of productivity" need to be agreed and indicators established. This has not been undertaken yet, although the Scottish Government's National Targets include increasing to 70% key commercial fish stocks at full reproductive capacity and ensuring they are harvested sustainably by 2015.
Data on economic benefits or economic use have been traditionally collected by way of Government statistics related to particular activities. Data are not collected in similar ways nor are data available for some activities where they form sub sets of larger-scale activities. For example, in Government statistics, port turnover and employment are sub sets of business activity although tonnage throughput is collected for each port.
To support the emerging UKMMAS Productive Seas Evidence Group ( PSEG) evidence base, a report entitled Socio-economic indicators of marine-related activities in the UK economy(2) is being prepared to provide economic data on a UK basis. This builds on a previous report, A new analysis of marine-related activities in the UK economy with supporting science and technology(3). Both of these reports gather data from Input-Output Tables and industry.
THE INPUT-OUTPUT APPROACH
Identification of the core marine environment industries
In order to estimate the value of the seas to the Scottish economy it has been necessary to decide which Scottish industries rely on the seas (or are marine related) in order to produce their output. No attempt has been made to discriminate between activities occurring in Scottish or non-Scottish waters. This initial identification of marine related industries was done using the UK Standard Industrial Classifications (2003) (4).
When deciding which industries represent a broad group definition such as marine-related (Table 5.2), care must be taken to ensure that non-marine industries that buy marine industry products are not included. However, it can be difficult to draw this distinction. An example in this case would be the fish processing industry. It buys 56% of all the Scottish domestic sea fishing industry output. It could be argued that if the fishing industry ceased to exist, the fish processing industry would import fish and continue to function. In such a scenario, it is also possible that much of the fish would still be caught in Scottish territorial waters by foreign boats. Further down the route to the final consumer it is easier to distinguish 'non-marine industries'. These will include packagers, wholesalers and retailers, as well as the restaurants that cook and serve the fish to the final consumer. Whilst they all add value, and therefore contribute to the economy, it could not be said that they would not continue to operate if there were no Scottish fishing industry.
Another example is the 'services ancillary to the oil and gas extraction industries'. It may be reasonable to assume that these mainland industries serving offshore oil and gas extraction activities (see North Sea oil below) would not exist in Scotland if oil had never been discovered in the North Sea. As such it could therefore be considered to rely on the (Scottish) sea and therefore classed as marine- related. However, now the industry and its offshore expertise is here, it is entirely possible that it would continue to operate elsewhere in the world (i.e. export) after North Sea extraction ceases. It therefore follows that it may not be possible to assume that the industry relies solely on the North Sea oil extraction industry.
It is therefore very difficult to know if an industry would continue to operate in the absence of a domestic (i.e. Scottish) supplier or customer and also whether the industry relies on Scottish seas or the sea in general. This analysis has assumed that the fish processing and services ancillary to the oil and gas extraction industries are core 'marine-related' industries rather than non-marine purchases of sea fishing and oil and gas extraction industry output.
Table 5.2 List of core marine-related industries
| Input-Output category (1) | Industry description | Standard Industrial Classification 2003 (2) |
|---|---|---|
IOC 3.1 |
Sea fishing |
( SIC 05.01) |
IOC 3.2 |
Fish farming |
( SIC 05.02) |
IOC 5 |
Service activities incidental to oil and gas extraction |
( SIC 11.2 & 12) |
IOC 9 (part) |
Processing and preserving of fish and fish products |
( SIC 15.2) |
IOC 78 |
Building and repairing of ships and boats |
( SIC 35.1) |
IOC 88 (part) |
Construction of water projects |
( SIC 45.24) |
IOC 95 (part) |
Sea and coastal water transport |
( SIC 61.1) |
Economic value - industry contribution to overall Scottish GDP
The economic value is taken as the contribution of the identified core marine-related industries to the overall Scottish Gross Domestic Product at basic prices (Gross Value Added ( GVA)). These are detailed in the Input-Output tables. Employment data for these industries are estimated using the Office for National Statistics Annual Business Inquiry.
Further to this initial value, it is possible to use the Input-Output analytical tables to estimate the economic value generated by non-marine-related industries supplying those identified as marine-related. These are the indirect effects and can be added into the core marine economic value because without the core industry demand, the economic value of these non-core industries would be affected.
For each of the identified core 'marine-related' industries the Input-Output tables have been used to calculate a proxy estimate of the GDP and employment created by other, non-marine-related industries that buy marine-related products. This is supported upstream output, related to the purchase of marine products and is not considered to be marine-related. This is because it is assumed that these industries would import the necessary products and would therefore continue to operate in the absence of the core domestic (Scottish) marine-related industries. The non-marine analysis is included because it can be useful to see which industries buy products from the core marine-related industries and the further economic value generated.
North Sea oil
In accounting for oil and gas activity in the North Sea, North Sea output is not included in Scotland's official GDP estimates. North Sea activity is instead included in the Extra Regio GDP data in the UK regional accounts, and not attributed to any specific UK region. Official GDP statistics for Scotland similarly exclude North Sea GDP. As such, the Input-Output model of the Scottish economy used to estimate core marine industry GVA and its associated upstream GVA does not take into account North Sea oil extraction activity. It does include all on-shore oil-related activity (Standard Industrial Classification ( SIC03) 11.2 "service activities incidental to oil and gas extraction excluding surveying").
Analysis was recently undertaken by the Scottish Government to estimate a realistic, notional share of Scottish North Sea output. The approximate estimate for 2005 was in the order of £20 billion of additional GDP (at market prices) as compared to total Scottish GDP (at market prices, excluding oil) of £98 billion in 2005.
Since the Input-Output model does not include North Sea Output, it is not possible to model any wider effects which might be concomitant with the transfer of a share of North Sea output to Scotland. Any wider effects might serve to increase or decrease Scotland's GVA.
Methodology summary
The value of the seas is taken to mean the contribution of the identified core marine environment industries to the overall Scottish GVA estimate plus the contribution of the upstream suppliers to the core marine environment industries.
The supported upstream analysis is included to show which industries buy products from the core marine-related industries and the further economic value they generate. This economic activity cannot be considered marine related. A fuller description of the methodologies used is in Annex 4.
Results
Table 5.3 shows the overall economic value (in terms of GVA and employment) for each of the identified core marine-related industries. As explained, this is in terms of the value of the identified industry category as detailed in the Input-Output tables, plus any indirect economic value associated with their purchase of products from other industries.
Table 5.3 Summary of marine-related industry GVA (£ million at 2004 prices) and employment (2004) [A]
Marine related industry |
Core industry |
Indirect |
Total |
Support upstream (proxy) |
||||
|---|---|---|---|---|---|---|---|---|
GVA (£m) |
Employment |
GVA (£m) |
Employment |
GVA (£m) |
Employment |
GVA (£m) |
Employment |
|
Sea fishing |
134.1 |
2,327 |
15.4 |
357 |
149.5 |
2,684 |
123.1 |
5,001 |
Fish farming |
72.3 |
1,492 |
49.4 |
976 |
121.7 |
2,468 |
6.0 |
213 |
Service activities incidental to oil and gas extraction |
592.3 |
10,928 |
419.3 |
8,733 |
1,011.6 |
19,661 |
138.5 |
2,528 |
Processing and preserving of fish and fish products |
228.0 |
8,813 |
253.4 |
5,291 |
481.4 |
14,104 |
25.1 |
842 |
Building and repairing of ships and boats |
244.7 |
5,849 |
68.1 |
1,367 |
312.9 |
7,216 |
47.9 |
1,073 |
Construction of water projects |
3.0 |
70 |
1.2 |
24 |
4.2 |
94 |
2.7 |
30 |
Sea and coastal water transport |
134.7 |
2,312 |
25.9 |
584 |
160.6 |
2,896 |
34.2 |
769 |
All marine sector |
1,409.0 |
31,790 |
746.9 |
15,793 |
2,155.9 |
47,583 |
284.1 |
7,441 |
Source: Input-Output tables for Scotland 2004
Partial Input-Output category core employment figures are based upon estimated output share applied to employment figures for the whole Input-Output category. Indirect and supported upstream figures are estimated using the Input-Output model. Each of the identified marine industries indirect and supported upstream effects will include activity between other marine industries. To prevent double counting, this activity is not included for the marine sector as a whole. As a result, the all marine sector totals will always be lower than the sum of the identified industries, except for the core industry columns.
FTE = Full Time Equivalent
In 2004, the total value of the marine-related sector was estimated to be £2.2 billion, and was estimated to support around 50,000 full-time equivalent employees. This represents 2.6% of the total Scottish GVA (£83 billion) and 2.4% of total Scottish full-time equivalent employment (around 2 million).
Within this overall figure, roughly half of the economic value is generated within the 'services incidental to oil and gas extraction' industry group, and roughly a quarter within the fish processing industry, followed by shipbuilding and repair, sea and coastal water transport, sea-fishing, fish farming and finally construction of water projects with an estimated economic value of £4.2 million.
The supported upstream analyses shows that almost as much economic value is generated by other industries with purchases from the sea fishing industry, as by the sea fishing industry itself. The majority of this is within the fish processing and hotels and catering sectors. Tables detailing the indirect and supported upstream industries for each of the identified core marine-related industries are in Annex 4.
The detailed indirect and supported upstream analysis shows that, of the overall economic value for the marine sector as a whole, 35% of this or £750 million (and 33% of employment or 16,000 full-time equivalent jobs) is generated indirectly by other industries who supply the marine-related industries. £100 million is generated within the banking sector, £70 million in renting of machinery industries and £60 million in the wholesale distribution industry.
Supported upstream analyses suggest that hotels, catering and pubs generate the most economic value from marine sector products (mainly from purchases from the sea fishing industry), followed by the oil processing industry (mainly from purchases from the services incidental to oil and gas industry) and public administration and defence (mainly from purchases from the ship building and repair industry).
EVIDENCE THAT THE SEA IS PRODUCTIVE
Table 5.4 shows an initial analysis of the distribution of responsibility between different organisations for the collection of data about the productivity of Scotland's seas. In addition to those listed other groups collect data, in particular specific industries may collect data that can be used to augment and support that collected by departmental or agency responsibilities.
It is too early for this interim assessment to draw firm conclusions about the overall productive state of Scotland's seas, especially with regard to sustainability. However, it is clear from the statistics for the various activities that the seas are well used as a resource. The questions remain, "to what degree of productivity are the seas used?" and "is it sustainable?". Different activities will be productive or sustainable to different extents. Some of the established activities, such as fisheries, will be "productively" exploiting resources with some stocks possibly within sustainable limits (or safe biological limits) while other activities that are comparatively new, such as renewable energy, will still be relatively "unproductive" when compared with the potential resource. At this stage of assessing Scotland's seas the approach adopted is to provide an introduction to the key individual industries including general assessments, together with some case studies which highlight relevant detail.
Table 5.4 Summary of data collected that could indicate whether Scotland's seas are productive
Indicators of productive seas |
Data collectors |
|---|---|
Marine fisheries |
Scottish Government, Scottish Fisheries Protection Agency, FRS |
Coastal salmon fishing |
Scottish Government, FRS |
Aquaculture (fin fish & shellfish) |
Scottish Government, FRS, Crown Estate |
Shellfish stock assessment |
FRS, Shetland Shellfish Management Organisation |
Oil and gas |
Department for Business, Enterprise and Regulatory Reform, Scottish Government |
Ports |
Scottish Government, Department for Transport |
Leisure and recreation |
No coastal/marine data collected except for specific studies or industry bodies, e.g. British Marine Federation |
Historic heritage |
Historic Scotland |
Renewable energy |
Scottish Government |
Dredge spoil disposal |
FRS |
Oil spills |
Advisory Committee on Protection of the Sea ( ACOPS) on behalf of the Maritime and Coastguard Agency |
Aggregate extraction |
Crown Estate |
An important aspect of resource management is evaluation of the available resource. This allows sustainable levels of production to be determined and allows productivity targets to be set. A tool developed for the Shetland shellfish fishery (see Case Study 5.2) demonstrates one way that this can be achieved. However, it should be noted that the assessment itself is resource intensive and it is not possible to replicate such detailed assessments for all shellfish fisheries nor indeed all marine resources.
Fishing
The Scottish fishing industry holds a key role in our nation's maritime history. Sea fishing has always been a part of Scottish life. For port communities such as Fraserburgh and Lerwick, it has provided the main source of employment for centuries and continues to do so in whitefish, pelagic and shellfish fisheries.
In recent years the industry has experienced alternating periods of prosperity and hardship, which has created irregular supplies of stock and instability in both the fish processing sector and the markets. Unsustainably high fishing mortality rates in the 1970s-1990s contributed to reducing population sizes, and the process of setting total allowable catch quotas through a series of negotiations between member states and the difficulties inherent in the Common Fishery Policy ( CFP) with regards to mixed fisheries have further contributed to the instability.
The Scottish Government's vision is for a Scottish seafishing industry which is sustainable, profitable, supportive of strong local communities and managed effectively as an integral part of coherent policy for Scotland's marine environment. Fish stocks at risk (such as cod) will be allowed to recover, stock management policies will aim to ensure that the industry avoids 'boom and bust' fluctuations. The quality of our marine environment will be safeguarded whilst the long term viability of the industry is assured. The newly-established Scottish Fisheries Council will provide a forum to bring scientists, stakeholders and policy-makers together to develop and implement marine fisheries policies that promote the industry and its communities whilst protecting the stocks and the marine environment.
Scottish fishing fleets
There are four broad types of fishing fleet which make up the Scottish fishing industry:
- The pelagic fleet mainly targets herring and mackerel. It is comprised of a relatively small number of large, profitable vessels, working usually out of Fraserburgh, Peterhead and Lerwick.
- The demersal or whitefish fleet targets bottom-dwelling fish in two types of fishery: the roundfish fishery in the North Sea and west of Scotland (which comprises cod, haddock, whiting and saithe) and the species found in the deeper water to the north and west of Scotland.
- The mixed demersal and shellfish fleet are the boats from the whitefish fleet which move between whitefish and Nephrops fisheries (prawn, or langoustine, fisheries).
- The shellfish fleet is those vessels that specialise in shellfish and Nephrops. They are mainly smaller than the pelagic fleet boats and operate within the inshore waters of the west coast, east coast, Borders, Fife, and south west of Scotland. A high proportion of these vessels are under 10 m.
Fishing ports and vessels
At the end of 2006, there were 2,224 active vessels based in Scotland. Stornoway had the largest number (303), followed by Fraserburgh (221) and Shetland (185). Lochinver had the smallest number (18), followed by Kinlochbervie (26) and Ullapool (67). This represents a net reduction of 62 vessels (or 3% of the fleet) since the end of 2005. In 2006, the segment of the fleet comprising vessels under 10 m in length (inshore and small shellfish vessels) decreased by 49 vessels (or 3%) to 1,518 vessels. The over 10 m fleet segment (pelagic, demersal and mixed demersal/shellfish vessels) decreased by 13 vessels (or 2%) to 706 vessels.
In recent years fishing vessel decommissioning, introduced as a conservation measure to bring the fishing fleet into line with available fishing opportunities, has resulted in a significant decrease in overall fishing capacity. The decommissioning schemes of 2001-2002 and 2003-2004 reduced the size of the whitefish fleet by 165 vessels. It is now thought that the size of the Scottish fishing fleet is in line with catching opportunities.
Employment in the Scottish fishing industry
In 2006, 4,109 people were regularly employed on Scottish-based vessels across all districts, with a further 999 irregularly employed and 97 crofters [B]. The total number of people employed in sea fishing (5,205 people) represents 0.2% of the total Scottish labour force.
Fraserburgh had the highest number of regularly employed fishermen (614), followed by Ayr (507) and Peterhead (412). Shetland and Stornoway had the highest number of irregularly-employed fishermen (156 and 152 respectively).
Landings and value of key stocks
The total quantity of fish landed by Scottish vessels has fallen by 15% since 2002. This is mainly due to reductions in the landings of demersal and pelagic fish (29% and 14% respectively). Shellfish landings actually increased by 14% over the same period. In 2006, 379,200 tonnes of live weight catch was landed by Scottish-based vessels. Of this total, 60% was pelagic species, 25% was demersal, and the remainder was shellfish. Figure 5.1 shows the estimated distribution of where the main commercial species (Table 5.5) are caught. The total combined value of these landings was £368.5 million, representing a 3% increase in value despite a decrease in live weight landed. For the first time, shellfish was the most valuable sector to the Scottish fleet, with shellfish landings representing 38% of total value despite its relatively small contribution in weight. Trends in the value of landings are shown in Figure 5.2. Based on 2006 prices, the value of demersal stocks has shown a noticeable decline since 1990. The value of pelagic stocks increased early in the period but has since fluctuated without obvious trend, while for shellfish the value was relatively stable until 2003 but has increased since. Landings made by Scottish vessels into Scottish ports in 2006 accounted for 83% of the total value of landings by Scottish-based vessels (including landings into foreign ports).
Information on landings and value is collected by the Scottish Fisheries Protection Agency and collated by statisticians in the Scottish Government Marine Directorate ( SGMD). FRS maintains an ongoing programme of research and monitoring to support fisheries management, which involves examination of the biology and state of commercially important fish stocks (see Case Study 4.5), and research into how changes in the marine environment affect fish stocks.
Impacts on fisheries
Scottish fisheries are potentially impacted by both environmental and anthropogenic factors. In recent years the seas around Scotland have been warming and there have been observed changes in plankton communities. The incidence of more southerly fish species migrating northwards has also increased. The relationships between these phenomena and the various species of commercial interest are complex and not fully understood. It does, however, appear that environmental conditions for species such as cod are less favourable at the present time. The implications for industry appear to be a reduced opportunity of some key species but there is no indication that stocks will be imminently reduced to the extent they are not commercially important.
Anthropogenic effects on fisheries include permanent structures, dumping at sea, oil and chemical spillages and fisheries themselves. These effects are sometimes relatively localised (for example the Braer oil spill (5)) and affect fisheries in the immediate vicinity but rarely affect entire stocks. Solid structures (for example oil platforms in the North Sea) potentially impede fishing activity but so far have a relatively small footprint compared to available fishing area. Furthermore these can sometimes provide beneficial effects as fish refugia or sites which favour recruitment.
One fishery can potentially impact on another through interaction between the targeted species. Pelagic species take food from the water column; demersal species and crustaceans living on the sea bed ultimately rely on material which comes down through the water column. Fishery induced disturbance to the balance of these processes may adversely affect one or more of the components. There is no evidence that the different types of fishery in Scotland have severely impacted each other but this needs to be carefully monitored. Historically, smaller species of fish such as sandeels have been exploited for the production of fish meal. These species are potential food items for larger human consumption species, although the latter typically take a variety of food. In the absence of a clear understanding of the contribution of small fish, care is also required in their exploitation.
Table 5.5 Seven commercial fish and shellfish species of major interest to Scotland
Demersal |
Pelagic |
Shellfish |
|---|---|---|
Cod |
herring |
Nephrops ( Norway lobster or langoustines) |
Haddock |
mackerel |
scallops (or 'clams') |
Monkfish (or angler fish) |
Fisheries impacts on the marine environment
Fishing activities impact on other components of the marine environment, the important question relates to whether the effects are short-term and reversible and, at the same time, do not compromise biodiversity. Potential impacts involving interaction with other species include unwanted bycatch. Monitoring of Scottish pelagic fisheries suggests that cetacean bycatch is very low. On the other hand discards of unwanted commercial and non-commercial fish and invertebrates remain unacceptably high in some demersal trawl fisheries. Scotland has taken a lead in tackling this through the use of gear technical measures (such as square-meshed escape panels) and the encouragement of behaviour which reduces unwanted catches (for example, real-time closures to avoid juvenile cod). The first voluntary real-time closure of a cod spawning ground was announced in the Scottish Parliament in January 2008.
Towed gears in particular have a physical impact on seabed features. Research suggests that in highly dynamic environments with mobile sediments (e.g. Solway Firth) the effects are not lasting, but in low energy environments (e.g. Loch Creran) this may not be the case. Under the Inshore Fishing Scotland Act 1984 some inshore and sea loch areas are closed to mobile gears to avoid disturbance to deep mud sediments. Open structured seabed features supporting complex communities (e.g. Lithothamnion or 'maerl' beds) are also known to be vulnerable to dredging and offshore, slow-growing deepwater corals areas have exhibited trawl damage. Scotland has been active in establishing closed areas to protect these features (for example, through a SAC to protect maerl near Arisaig and the announcement in January 2008 of a consultation to establish a marine conservation area at Lamlash Bay, Arran) and has been supportive of EU efforts to protect deepwater habitats. Areas frequently trawled may suffer damage to less exotic species of bivalve molluscs, sea urchins and polychaetes. Secondary and less obvious effects of different patterns of fishing might be expected to have a secondary and less obvious affect on the balance of predators and prey but this appears not to have been studied to any great extent.
While closed areas or MPAs play an important role in conserving sensitive marine environments and can be important in protecting key life stages of commercial species, reliance on them as a principal fisheries management measure is more questionable. Simulation studies suggest such areas would require to be very large and be accompanied by significant effort reductions to avoid the potentially deleterious effects of effort transfer. In recent years Scotland has undertaken major decommissioning schemes and has observed days at sea regulations in order to reduce fishing activity. This potentially benefits commercial species, other components of the ecosystems in which they live, and habitats.
Summary Assessments for the state of the seven commercial species of major interest to Scotland are included in chapter 4. This report has not attempted to assess the productivity of the fisheries in economic terms.
Figure 5.1 Estimated location of area of catch (tonnes) of main commercial species by Scottish vessels in 2006
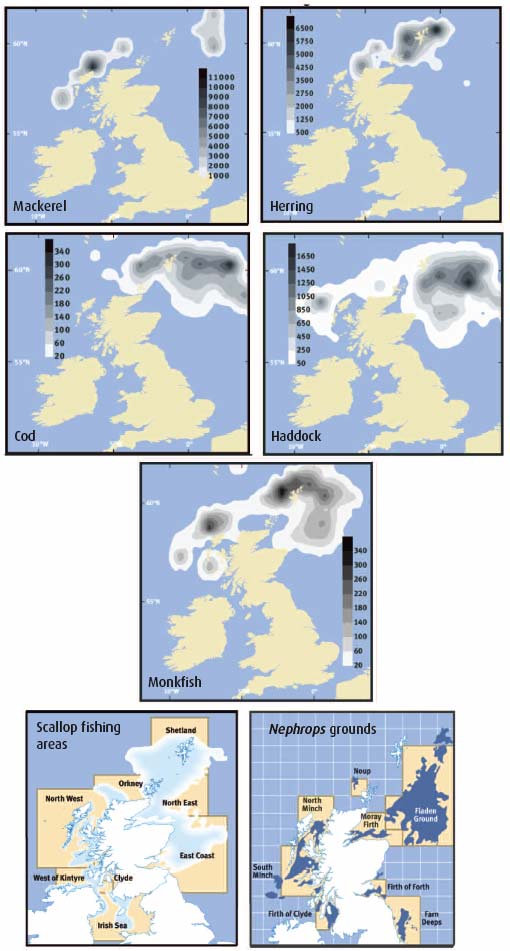
Figure 5.2 Value [C] of landings at 2006 prices by Scottish-based vessels by species type, 1990 to 2006
![Figure 5.2 Value[C] of landings at 2006 prices by Scottish-based vessels by species type, 1990 to 2006](/binaries/content/gallery/publications/publication/2008/04/scotlands-seas-towards-understanding-state/0063892.gif)
Coastal salmon fishing
The Salmon and Freshwater Fisheries (Consolidation) (Scotland) Act 2003 states the use of rod and line (rarely used), net and coble (limited to the inner Moray Firth and some west coast sea lochs) and bag net, fly net or other stake net as the only lawful methods outside estuary limits of catching salmon.
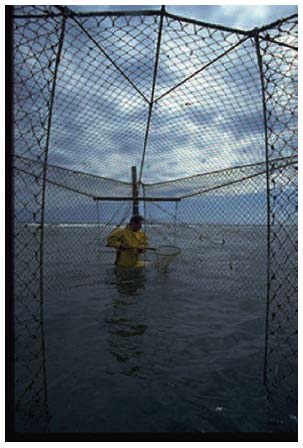
Coastal salmon fishing uses net fisheries, known as fixed engines (Figure 5.3), which are set in positions which have been determined by generations of fishers. The rights to fish are held as private, heritable titles either by individuals, companies or the Crown. Fixed engines comprise a curtain of netting extending up to 300 m seawards from the shore and up to 4 m deep. A trap at the seaward end catches the salmon. Netting is highly regulated including a minimum mesh size and closure periods. In 2006, 4,169 kg of salmon and sea trout were caught using fixed engines (6).
Fishing effort now is about 10% of that in 1952 (7) mainly due to reduced catches making this method of fishing uneconomic. Only the more productive fisheries remain in operation.
Salmon fishing is very seasonal, generally from mid February to late August. The number of netsmen employed varies throughout the season, depends upon the number of gear units deployed and can range from 1 to 6 per station. There are 45 fishing stations in mainland Scotland (east coast (22), north coast (5) and west coast and islands (18)). The value of this coastal activity to the economy is not known, however, it can be very valuable at an individual fisher level. An overall productivity assessment is not considered appropriate here.
The fixed engines have a limited impact on the seabed, being held in place by anchors and chains. Bycatch is negligible.
Figure 5.3 Fixed engine salmon net
Aquaculture - finfish and shellfish
Commercial aquaculture began in Scotland in the mid 1970s, and became well established in the 1980s and 1990s. In 2006, Scottish production of marine finfish represented >99% of UK culture marine finfish and shellfish or some 150,000 tonnes. This production is dominated by Atlantic salmon at 131,847 tonnes (Figure 5.4); Scotland is the largest producer in the EU and the third largest producer in the world, behind Norway and Chile. This is followed by rainbow trout. Increasing numbers of alternative species are being produced including trout, cod and halibut, with some 1,050 tonnes of these species produced during 2006. Shellfish - Pacific oyster, native oyster, common mussel, scallop and queen scallops - accounts for 4,594 tonnes in 2006. Aquaculture is a vitally important industry, in terms of the geographic locations in which it operates, predominantly the west, north west, Western Isles and Northern Isles (Figure 5.5). Many communities are sustained by the employment provided, particularly salmon farming.
The Scottish Government's vision for aquaculture (finfish and shellfish) is set out in its Strategic Framework for Scottish Aquaculture(8), first published in 2003. Its vision is that "Scotland will have a sustainable, diverse, competitive and economically viable aquaculture industry, of which its people can be justifiably proud. It will deliver high quality, healthy food to consumers at home and abroad, and social and economic benefits to communities, particularly in rural and remote areas. It will operate responsibly, working within the carrying capacity of the environment, both locally and nationally and throughout its supply chain."The Strategy has four principles: economic; environmental; social; and stewardship. The Scottish Government works closely with the industry and other key stakeholders, and others who operate in the freshwater and marine environment.
Finfish production
Salmon
In 2006 marine production was undertaken by 44 companies farming 252 active sites. Production showed an increase of 2% over the 2005 figure, which reverses a downward trend since a peak production in 2003 of 169,736 tonnes. Production is undertaken by means of seawater tanks and seawater cages, with the majority being undertaken in the latter. Overall, production was dominated by 11 companies in 2006, producing over 90% of the salmon.
Figure 5.4 The trend in annual production of Atlantic salmon
Figure 5.5 Active seawater fish and shellfish farms in Scotland
Rainbow trout
Farming of rainbow trout is undertaken on both freshwater and seawater sites. A total of 7,492 tonnes of rainbow trout were produced in 2006, of which some 31% or 2,341 tonnes was produced in 10 saltwater sites. Rearing took place in cages.
Other species
There has been continued interest in the farming of other species - brown trout/sea trout, cod and halibut. Production totals 1,046.5 tonnes between 47 companies. The largest expansion is within the cod sector which produced 543 tonnes in 2006 and is estimated will produce 2,902 tonnes in 2007. These species provide diversification from the production of rainbow trout and Atlantic salmon. They allow some of the smaller companies to remain within the aquaculture sector and for the larger companies to broaden their production base.
Shellfish production
One hundred and seventy three companies were active in shellfish production in 2006, operating on 327 active sites, of which 156 (44%) placed shellfish on the market. In this year 4,219 tonnes of shellfish were produced. Suitability of shellfish for human consumption is critical to the market's success. Case Study 5.1, shows how regular monitoring is important to have early warning of any potential problems. Mussels dominated production (4,287 tonnes), followed by Pacific oyster (251 tonnes), queen scallops (60 tonnes), scallops (40 tonnes) and native oyster (24 tonnes). Production of these species is being maintained, though that of farmed scallops increased more than three-fold in 2006. The major areas of production are Shetland and Argyll and Bute. The industry is dominated by small-scale producers, though there is a continued trend towards large companies contributing significantly to the production of all species. Case Study 5.2 demonstrates the importance of resource evaluation as a management tool.
Data Collection
FRS carries out annual production surveys on behalf of the Scottish Government which collates annual production data from registered fish farm sites. The last full year of data available is 2006 (9).
Employment in the aquaculture sector
Salmon production directly employs 1,142 employees and is the most important economic sector in the Highlands and Islands, a mainly rural area. The rainbow trout sector (both freshwater and saltwater) directly employs 143 employees; other species 92 full-time employees and 17 part-time employees. The shellfish sector directly employs 160 full-time employees, 160 part-time employees, and 80 casual workers. Processing also employs large numbers of workers, though their current numbers are not known. While employment figures continue to decline as a whole throughout the aquaculture sector, the mean productivity per person is increasing throughout the fin fish sector. For Atlantic salmon production, this increased from 132.4 tonnes per person in 2005 to 151.4 tonnes in 2006.
Aquaculture has an annual turnover of over £280 million (2005); made up of £260 million (farmed salmon), about £10 million (rainbow, brown and sea trout), about £2 million (halibut and cod) and about £6 million (shellfish). The value of all fish exports (including aquaculture) from Scotland in 2005, (the most recent figures) was £420 million, which accounts for 60% of all food exports.
Impacts
The Scottish Government is committed to a sustainable, diverse, competitive and economically viable aquaculture industry that operates within its environmental carrying capacity. Case Study 5.3 discusses the environmental impacts further. A number of initiatives are in place to complement existing legislation to provide protection for the environment. These include a working group to examine the siting of facilities; the publication of the Environmental Impact Assessment Practical Guidelines Toolkit for Marine Fish Farming in September 2007 (10), providing guidance for planners, applicants and stakeholders and the industry prepared Code of Good Practice for Scottish Finfish Aquaculture(11). In addition, the Aquaculture and Fisheries (Scotland) Act 2007, inter alia, underpins the industry Code of Good Practice and makes relevant legal powers and provisions in relation to containment and sea lice. The Strategic Framework for Scottish Aquaculture is being reviewed with the aim of maximising benefits from the industry in a sustainable way.
Summary Assessment
Parameter |
Geographical region |
Key factors & pressures |
What the evidence shows |
Trend |
Status now |
Confidence in assessment |
Reason for overall status |
|---|---|---|---|---|---|---|---|
Tonnage of fish produced |
Clyde, Minches & Malin Sea, Hebrides, North Scotland Coast, East Shetland, West Shetland |
Demand and market conditions |
Production fallen in recent years. Expected to increase but may take until 2011 to reach 2003 levels. |
III |
Detailed knowledge of industrial output |
CASE STUDY 5.1 Safeguarding shellfish quality
The cultivation, harvesting and sale of bivalve molluscs are important to the Scottish economy. Marine phytoplankton is the food source for these filter-feeding organisms.
The vast majority of marine phytoplankton are benign. However, under certain conditions, a relatively few species produce toxins, some of which can accumulate within filter-feeding shellfish.
The perception exists that harmful or toxin-producing phytoplankton is increasing worldwide. It remains unclear whether this is because of improved monitoring and detection, climate change, ballast water transfer or the activity of humans in the coastal zone. However, in Scottish waters a number of independent reviews have found no evidence to link harmful phytoplankton with anthropogenic activity.
Although the shellfish themselves may not be affected, the concentration of the toxin in the shellfish flesh could cause humans ingesting affected shellfish to suffer subsequent ill health.
The Food Standards Agency Scotland ( FSAS) is required, under Regulation ( EC) No 854/2004 to monitor shellfish harvesting areas around Scotland for the occurrence of toxic phytoplankton, and for the presence of their toxins in shellfish. Monitoring and analysis of phytoplankton and toxins is conducted by SAMS, Integrin Advanced Biosystems Ltd and Cefas.
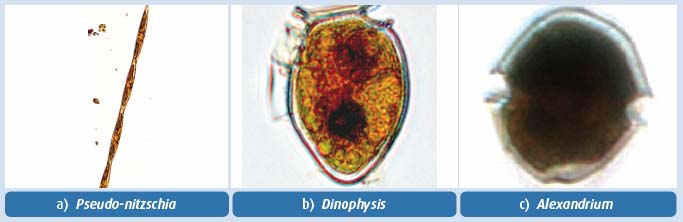
Three main groups of toxins are routinely monitored. These are: the domoic acid group, responsible for Amnesic Shellfish Poisoning ( ASP), generated by diatoms of the genus Pseudo-nitzschia; the lipophillic shellfish toxins including compounds that cause Diarrhetic Shellfish Poisoning ( DSP), mostly generated by the genus Dinophysis; and the saxitoxins, which lead to Paralytic Shellfish Poisoning ( PSP), generated by the genus Alexandrium (Figure 5.6). Shellfish harvesting areas will experience temporary closures due to the detection of ASP, DSP and PSP toxins in shellfish at levels that exceed the EU regulatory limits.
Shellfish are sampled from around 100 commercial harvesting areas for the presence of ASP, DSP and PSP toxins. Toxin-producing phytoplankton is also monitored in 41 coastal sites.
Enumeration of phytoplankton species has the potential to be used as an early warning of the possible occurrence of shellfish biotoxin events. To facilitate this, threshold concentrations of the main genera of phytoplankton have been determined by comparing phytoplankton counts with the presence of these toxins in shellfish.
Figure 5.6 Main genus of toxin-producing phytoplankton monitored in Scottish waters
Phytoplankton monitoring conducted since 2005 has detected one or more toxic species of phytoplankton at concentrations exceeding the threshold levels in all of the locations sampled (Table 5.6), highlighting the potential impact of toxin events on the shellfish industry.
Waters around Shetland are particularly susceptible to toxic phytoplankton events. Between 1 April 2006 and 31 March 2007, the monitoring programme detected DSP in 11 harvesting areas and PSP in 15 harvesting areas. Monitoring in Shetland has confirmed the importance of regular water sampling in the early detection of toxic phytoplankton blooms and prediction of biotoxin events in shellfish. Figure 5.7 illustrates the evolution of toxin events in shellfish harvesting areas in Vaila Sound, Shetland during 2006. Increasing numbers of phytoplankton (blue line on the graphs) were identified in advance of elevated biotoxin levels in mussels (bars on the graphs) providing an early warning of the event.
Table 5.6 Phytoplankton monitoring conducted in Scotland from September 2005 - October 2007
Location |
Number of |
Percentage of samples |
Percentage of samples |
Percentage of samples |
|---|---|---|---|---|
Argyll |
783 |
4 |
14 |
6 |
Dumfries & Galloway |
35 |
0 |
31 |
0 |
Fife |
52 |
0 |
23 |
0 |
Lochaber |
27 |
2 |
30 |
11 |
Sutherland |
89 |
7 |
21 |
10 |
Western Isles |
188 |
13 |
34 |
21 |
Ross & Cromarty |
67 |
15 |
19 |
12 |
Borders |
16 |
0 |
19 |
25 |
Shetland |
596 |
14 |
45 |
23 |
Skye & Lochalsh |
113 |
8 |
24 |
27 |
Orkney |
93 |
18 |
47 |
15 |
Source FSAS. Thresholds are Pseudo-nitzschia - 50,000 cells/litre; Alexandrium - presence; Dinophysis - 100 cells/litre.
Figure 5.7 Evolution of DSP and PSP toxin events at Vaila Sound: Riskaness (A), Linga (B), and East of Linga (C) from June-September 2006
© Crown copyright. All rights reserved Scottish Government 100020540 (2008).
Cultivation of bivalve molluscs is an environmentally sustainable form of farming. However unregulated production or consumption of this natural product has inherent health risks from naturally occurring marine biotoxins. Regular and intensive monitoring of toxins in shellfish and the causative phytoplankton in water, combined with closures of harvesting areas that are experiencing toxic events are essential in protecting public health and in maintaining consumer confidence in this resource.
Summary Assessment
Parameter |
Geographical region |
Key factors & pressures |
What the evidence shows |
Trend |
Status now |
Confidence in assessment |
Reason for overall status |
|---|---|---|---|---|---|---|---|
Shellfish safety |
Regulated shellfish harvesting areas |
Marine biotoxins |
Human health safeguarded by preventative monitoring of phytoplankton and biotoxins |
|
III |
Weekly monitoring programme |
CASE STUDY 5.2 Shetland shellfish stock assessment programme
The shellfish fisheries around Shetland have been managed by the Shetland Shellfish Management Organisation ( SSMO) using a Regulating Order since 2000. As a result of this legislation all vessels fishing within the six-mile limit must obtain a licence from the SSMO and fishermen are required to submit log sheets summarising their catch and effort data. This information, combined with data from surveys and applied research carried out by the North Atlantic Fisheries College Marine Centre, has resulted in one of the most detailed fisheries data sets in Europe.
The fisheries data are collected at a fine spatial scale using 5-mile statistical squares (Figure 5.8) producing detailed spatial information on catch and effort for each of six main commercial species: lobsters, edible crabs (Figure 5.9), velvet crabs, scallops, queen scallops and whelks. These and other data are used to carry out annual stock assessments to support the management process.
The stock assessments are carried out using standard approved techniques and provide vital information on the status of the shellfish stocks. Standard length cohort analysis ( LCA) for crabs and lobsters and virtual population analysis ( VPA) for scallops are used to assess stocks. Trends in landings per unit effort data ( LPUE) from SSMO logbooks are also investigated, and further analysed within a generalized additive modelling ( GAM) framework. The results of the stock assessments, LPUE trends and analysis and applied research are used to provide management recommendations based on the status of the shellfish stocks.
This data set represents a unique and very detailed resource, and is an extremely useful tool in the management of the shellfish fisheries around Shetland.
Summary Assessment
Parameter |
Geographical region |
Key factors & pressures |
What the evidence shows |
Trend |
Status now |
Confidence in assessment |
Reason for overall status |
|---|---|---|---|---|---|---|---|
Shellfish stock assessment |
Six mile limit around Shetland |
Fishing |
Shetland shellfish stocks are in a healthy state |
III |
High quality fisheries data at a fine spatial scale |
Figure 5.9 Brown crabs
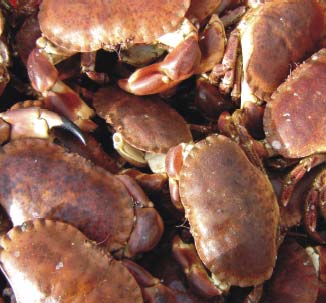
Figure 5.8 Area covered by the Shetland Regulating Order
Figure shows the statistical squares used for data collection divided up into four geographical areas.
CASE STUDY 5.3 Marine finfish aquaculture - interactions with the environment
Potential interactions between aquaculture and the marine environment arise from the release of particulate organic matter, dissolved nutrients, veterinary medicines and anti-foulants, which may affect seabed and water quality, while escaped fish may interbreed with wild stocks.
The discharge of particulate organic matter from fish cages, in the form of faeces and waste feed, affects the sea bed in the immediate vicinity of the cages. High rates of carbon deposition significantly affect sediment chemistry and infaunal diversity. These effects are regulated under The Water Environment (Controlled Activities) (Scotland) Regulations (2005) ( CAR) by SEPA through the issuing of discharge consents.
Monitoring of the sea bed conducted for licensing purposes, in addition to broader-scale monitoring of sediments in Scottish sea lochs, indicates that significant effects on sediment quality from fish farms are confined to areas very close (<100 m) to cages and that the majority of these effects are compliant with sediment Environmental Quality Standards ( EQS).
The addition of nitrogen from anthropogenic sources (such as the feed fed to farmed fish) has the potential to cause deleterious effects resulting from accelerated planktonic growth. The quantities of nutrients discharged to Scottish waters as a result of fish farming activities have increased in line with production trends in the industry and improvements in the efficiency of farming practices (Figure 5.10).
An extensive monitoring programme conducted by FRS and SEPA between 2002 and 2006 assessed the eutrophication status of Scottish marine waters which were identified by modelling as most likely to be at risk of effects from nutrient enhancement from fish farms (12). Nutrient concentrations, ratios and input trends were assessed along with the likely effects of nutrients on plankton, seaweeds, water and sediment chemistry, fish kills and algal toxins. No evidence of nutrient enhancement or accelerated growth of plankton or seaweeds was found. There was some evidence of harmful planktonic species, and their effects, however, these events are not thought to be caused by nutrients from fish farms.
Chemical discharges from fish farms include antibiotics, sea lice treatments and antifoulants. Since the development of a wide range of effective vaccines, the use of antibiotics has declined to low levels, however, in-feed and bath treatments for sea lice and copper-based antifoulants are widely used across the industry and regulated under CAR. SEPA sediment monitoring surveys have shown that there is no significant occurrence of medicines in sediments at concentrations above EQS at sites outside the immediate vicinity of fish farm cages. Unfortunately parasites, especially the sea louse, become immune to frequently used pesticides and there is a demand from the industry to use new active ingredients and new formulations to counter this problem.
There is potential for salmon farms to have deleterious effects on local populations of wild salmonids through genetic introgression or competition from fish farm escapes and as a result of potential increased disease prevalence in wild stocks through contact with diseased farm fish, for example through increased infective pressure from lice on farmed fish.
The majority of escapes involve Atlantic salmon and are caused by weather, equipment failure and damage caused by the action of predators. Reported numbers of escaped fish were approximately 1% of stock held during 2002- 2007 (Figure. 5.11).
Figure 5.10 Increasing nitrogen inputs from fish farming 1990-2004 shown by sea area
Southern west coast (Loch Ryan to Mull), Minches and Western Isles (Mull to Cape Wrath) and North coast / Northern Isles (Cape Wrath to Moray Firth).
Figure 5.11 Escapes of farmed fish 2002-2007
Overall, despite the dramatic rise in the production tonnage in the last two decades, the control measures in place by regulatory authorities address the main processes by which aquaculture may adversely affect the surrounding environment.
Summary Assessment
Parameter |
Geographical region |
Key factors & pressures |
What the evidence shows |
Trend |
Status now |
Confidence in assessment |
Reason for overall status |
|---|---|---|---|---|---|---|---|
Impacts on the seabed |
Clyde, Minches & Malin Sea, Hebrides, North Scotland Coast, East Shetland, West Shetland |
Particulate and chemical discharges from fish farms |
Very localised significant impacts on sediment quality and infaunal diversity |
III |
Plethora of benthic monitoring data |
||
Impacts on water column |
Clyde, Minches & Malin Sea, Hebrides, North Scotland Coast, East Shetland, West Shetland |
Nutrient discharges from fish farms |
Increasing nutrient inputs in some areas but no significant enhancement or deleterious effects |
|
III |
Extensive eutrophication assessments of sea lochs |
|
Effects on wild fisheries |
Clyde, Minches & Malin Sea, Hebrides, North Scotland Coast, East Shetland, West Shetland |
Escapes of farmed fish. Transmission of disease. |
Large losses of farmed fish |
I |
Room for reduction in escapes. Low confidence in effects on wild populations. |
Oil and gas industry
Oil and gas exploitation has been a major activity in the waters around Scotland since the 1970s and has contributed significantly to the Scottish economy:
- approximately 145,000 jobs in Scotland are provided by the industry, representing 43% of the total UK oil and gas employment (13) according to Scottish Enterprise;
- there are over 2,000 Scottish companies involved in the industry;
- there is an onshore manufacturing industry for equipment, pumps and pipelines, etc; and
- in 2006, the UK continental shelf (no specific Scottish figures available) produced 70 million tonnes of oil (14) and 84 million cubic metres of gas (15).
The nearest production platform to shore is the Beatrice field in the outer Moray Firth which is on the territorial sea limit. The rest of the activity is well outside territorial waters and there are main clusters west of Shetland and east of Shetland which extends southwards to the southern North Sea. The nearest of these further platforms, Buzzard, is about 55 km NE of Rattray Head. However, oil and gas come ashore through a number of main export pipelines to facilities on Shetland (Sullom Voe) (3 import, 1 export) and Orkney (Scapa Flow) (1) for onward export in tankers or by pipeline to enhance oil recovery at other fields (1), and at St Fergus (6) and Cruden Bay (1) for onward transport by overland pipeline. There are tanker handling facilities at Sullom Voe, Flotta (Scapa Flow), Braefoot Bay, Hound Point (Firth of Forth) and Finnart.
For the industry to develop, major infrastructure emerged around the Scottish coast in the 1970s. Key supply bases remain at Aberdeen, Peterhead and Lerwick. There are large onshore oil, gas and chemical refineries at Grangemouth, Kinneil, St Fergus and Mossmorran. The initial platform construction yards at Hunterston, Ardyne Point, Kishorn and Ardersier are no longer in use with that at Nigg currently mothballed. The once busy pipeline fabrication centres at Tain and near Wick are now rarely used, although there is an active pipeline fabrication unit at Evanton in the Cromarty Firth.
The impacts that oil and gas activity can have on the marine environment, and therefore on the status of the seas, are:
- The initial construction of the onshore facilities. These impacts would be considered as part of an environmental assessment associated with the consenting regime at the time of construction. The majority of coastal facilities were constructed before the current environmental assessment regime was implemented. The effects of the actual build would probably be short-term in nature although any land reclamation would obviously make long-term physical changes to the coastline.
- The initial construction of the offshore facilities. A strategic environmental assessment ( SEA) regime today accompanies each round of new exploration and production licences. Individual assessments are undertaken on the impacts of underwater acoustic releases associated with seismic survey and for all drilling and pipeline operations to be conducted offshore. Drill cuttings derived from operations using water-based muds may be placed on the seabed next to platforms but it should be noted that cuttings from oil-based mud use are no longer released to sea, all being either re-injected into the formation from which they came or returned to shore for processing and disposal.
- During the operational phase the discharge of substances either during normal operations or due to accidental or emergency events may impact upon the marine environment, see case study 3.6. Discharges of operational chemicals are controlled under BERR legislation based on a chemicals risk management system. FRS acts as an adviser to BERR on both the chemical and environmental risk posed by such discharges.
There may be some positive benefits of platform presence because of the creation of safety zones for 500 m around each installation, which restrict access, and because this may stimulate the creation of substrate for corals.
There are no Government targets associated with the oil and gas industry. It is a market-driven economic activity.
The Advisory Committee on Protection of the Sea ( ACOPS) prepares an annual report on behalf of the Maritime and Coastguard Agency ( MCA), the Annual survey of reported discharges attributed to vessels and offshore oil and gas installations operating in the UK Pollution control zone 2005.(16) The survey generates statistics concerning incidents involving discharges of oil, noxious liquid substances and garbage from all types of vessels and offshore oil and gas installations. Figure 5.12 shows the reporting areas used and Tables 5.7 and 5.8 show statistics from 2005.
Table 5.7 Total pollution incidents associated with marine installations and shipping reported by category and area in 2005
Area |
Mineral oils |
Garbage |
Vegetable & animal oils |
Chemicals |
Other substances |
Totals |
|---|---|---|---|---|---|---|
Western Scotland |
12 |
0 |
0 |
0 |
0 |
12 |
Orkney & Shetland Islands |
10 |
0 |
0 |
0 |
0 |
10 |
Eastern Scotland |
26 |
0 |
1 |
0 |
0 |
27 |
UKCS oil & gas installations |
282 |
0 |
0 |
97 |
4 |
383 |
UKCS vessels |
24 |
0 |
0 |
2 |
0 |
26 |
Total |
354 |
0 |
1 |
99 |
4 |
458 |
Table 5.8 Total incidents and amount of pollution reported by marine environmental area in 2005
Area |
Open sea |
Tidal river/estuary |
Bay/near shore |
Beach/shore |
Port/harbour |
Totals |
1-455 litres |
456-999 litres |
1-50 tonnes |
> 50 tonnes |
Not known |
|---|---|---|---|---|---|---|---|---|---|---|---|
Western Scotland |
0 |
0 |
4 |
0 |
8 |
12 |
10 |
1 |
1 |
0 |
0 |
Orkney & Shetland Islands |
3 |
0 |
1 |
0 |
6 |
10 |
7 |
0 |
1 |
1 |
1 |
Eastern Scotland |
5 |
0 |
2 |
1 |
19 |
27 |
21 |
0 |
6 |
0 |
0 |
UKCS oil & gas installations |
383 |
0 |
0 |
0 |
0 |
383 |
301 |
23 |
37 |
0 |
22 |
UKCS vessels |
26 |
0 |
0 |
0 |
0 |
26 |
11 |
2 |
5 |
0 |
8 |
Total |
417 |
0 |
7 |
1 |
33 |
458 |
350 |
26 |
50 |
1 |
31 |
Figure 5.12 Areas used by ACOPS to report discharges from vessels or oil and gas installations
Summary Assessment
Parameter |
Geographical region |
Key factors & pressures |
What the evidence shows |
Trend |
Status now |
Confidence in assessment |
Reason for overall status |
|---|---|---|---|---|---|---|---|
Economic value of oil and gas industry |
Continental shelf mainly beyond 12 nautical miles offshore |
Global demand for oil and gas |
A productive industry but some uncertainty about its value to Scotland even though most of the UK industry occurs on Continental Shelf adjacent to Scotland |
|
III |
High level of historical investment; high national strategic importance; buoyant world market |
|
Frequency and size of pollution incidents |
Continental shelf mainly beyond 12 nautical miles offshore |
High level of activity; aging infrastructure |
Frequent though local and relatively small incidents |
III |
Closely monitored and highly regulated |
Ports
There are over 100 ports in Scotland ranging from very small to those with major facilities. They include:
- large oil and gas terminals, e.g. Hound Point (Firth of Forth), Sullom Voe (Shetland), Flotta (Scapa Flow, Orkney);
- large quarry product port - Glensanda;
- large fishing ports, e.g. Peterhead, Fraserburgh;
- smaller fishing ports, e.g. Buckie, Mallaig;
- oil supply ports, e.g. Aberdeen (Figure 5.13), Cromarty Firth;
- multi-purpose ports, e.g. Leith, Clyde;
- large container ports - Grangemouth;
- major ferry ports serving Ireland and Europe - Cairnryan, Stranraer and Rosyth - as well as lifeline ferry services within Scotland;
- "marine Works" serving as pier heads for ferry services to Scotland's islands and for working boats associated with fish farm installations; and
- marina facilities, e.g. Fairlie, Craobh Haven, Port Edgar.
Eleven Scottish ports are classified by the Department for Transport under the EC Maritime Statistics Directive as major ports (generally because they handled at least 1 million tonnes (Mt), of cargo in 2001). These are: Forth (31.5 Mt in 2006), Sullom Voe (Shetland) (19.4 Mt), Clyde (14.9 Mt), Orkney (11.2 Mt), Glensanda (6 Mt), Aberdeen (4.6 Mt), Cromarty Firth (3.2 Mt), Cairnryan (3.1 Mt), Dundee (1.2 Mt), Stranraer (1.2 Mt) and Peterhead (0.9 Mt). Total cargo handled for all Scottish ports in 2006 was 101.5 Mt.
Some of the traffic flows between ports and the imports and export figures are shown in Table 5.9.
Figure 5.13 Aberdeen oil base
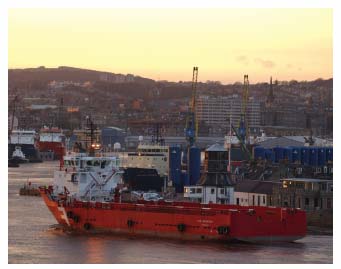
Table 5.9 Total traffic in Scottish ports in 2006
Type of traffic |
Volume (Mt) |
Type of traffic |
|
|---|---|---|---|
Exports |
Imports |
||
"Coastwise" traffic to other ports in the UK (including Scotland) |
20.6 |
7.8 |
"Coastwise" freight discharged in Scotland (including freight from elsewhere in Scotland) |
"One port" traffic to offshore installations |
1.5 |
8.3 |
"One port" traffic (nearly all from oil platforms) was discharged in Scotland |
Exports from major Scottish ports |
44.0 |
17.9 |
Imports at major Scottish ports |
Freight lifted by water transport in Scotland - main categories |
66.1 |
34.0 |
Freight landed by water transport in Scotland - main categories |
Source: Scottish Transport Statistics No.26 2007 edition, Scottish Government
The main types of cargo handled by the Scottish major ports in 2006 were crude oil (53.3 Mt), oil products (9.2 Mt), coal (10.9 Mt), "other dry bulk" (7.7 Mt) and liquefied gas (3.2 Mt).
Passenger traffic is also important. In 2006, 2 million passengers were carried between Scotland and Northern Ireland, the busiest port being Stranraer (1.2 million passengers). 112,000 passengers travelled between Rosyth and Belgium (Zeebrugge). In addition, around 8.1 million passengers were carried on internal Scottish ferry services (Cal Mac 5.4 million, Northlink 0.3 million, Orkney Ferries 0.3 million, Shetland Council 0.8 million, Western Ferries 1.3 million).
A new system for collecting detailed port traffic statistics was launched in 2000 to comply with the requirements of the EC Maritime Statistics Directive. Details can be found in the Department for Transport's publication, "Maritime Statistics" which can be found on the DfT Web site (17). In terms of the economic activity of ports, no targets are set by Government or collectively by the industry. Market forces and commercial considerations will determine such activity, within the context of the legislative framework within which ports operate, which includes environmental responsibilities.
The main impacts that ports and shipping can have on the marine environment and therefore on the status of the seas are:
- The construction of the port facilities. These impacts are considered as part of an environmental assessment associated with the consenting regime at the time of construction. It is usually expected that any environmental effects of the actual construction would be short-term in nature. In future, hydromorphological effects will also be considered as part of WFD requirements.
- The discharge of substances from shipping either accidentally during normal operations or due to emergency events (see Tables 5.7 and 5.8).
- The disposal of dredged material removed from navigation channels, berths and turning channels to keep ports operational. All such disposal requires a licence under Part II of the Food and Environment Protection Act ( FEPA) 1985 which is managed by FRS. The figures for amounts of dredged material disposed in 2006 are in Table 5.10. Most disposal takes place on the east coast. Historically, sediment concentrations of trace metals and polychlorinated biphenyls ( PCBs) show values that do not preclude the sea disposal of dredged material. The list of contaminants used to assess the suitability of sediment for sea disposal has now been increased to include polycyclic aromatic hydrocarbons ( PAHs) and tributyl tin ( TBT). As part of its ongoing environmental monitoring programme, FRS samples disposal sites on a regular basis for the presence of heavy metals, PAHs, TBT and PCBs. To date, results have shown that average contaminant concentrations fall below thresholds recommended by Government (18,19) Therefore future disposal operations at these sites are possible, provided the quantity, quality and type of dredged material is consistent with previous disposal operations.
Table 5.10 Dredge spoil disposal in 2006 (wet tonnes)
Area of Dredging |
Licensed Tonnage |
Tonnes Disposed |
Reporting Area |
|---|---|---|---|
Girvan, Ayr, Troon, Glasgow, Greenock & Hunterston |
1,569,573 |
244,846 |
Clyde |
Bruichladdich, Port Ellen & Ullapool |
29,330 |
24,116 |
Minches & Malin Sea |
Foula |
1,750 |
1,750 |
West Shetland |
Burghead, Buckie, Findochty, Portknockie & Macduff |
169,649 |
43,535 |
Moray Firth |
Aberdeen, Montrose, Arbroath, Dundee & Berwick |
688,755 |
302,463 |
East Scotland Coast |
Upper Forth Crossing, Kincardine, Grangemouth, RNAD Crombie, Rosyth, Royal Forth Yacht Club & Leith |
4,739,699 |
1,087,908 |
Forth |
TOTAL |
7,198,756 |
1,704,618 |
Summary Assessment (also see assessment of pollution incidents under oil and gas industry)
Parameter |
Geographical region |
Key factors & pressures |
What the evidence shows |
Trend |
Status now |
Confidence in assessment |
Reason for overall status |
|---|---|---|---|---|---|---|---|
Economic value of ports |
Specific locations around the Scottish coast and islands |
Demand for imported and exported goods; in particular national dependence on oil and oil products; travel / tourism / transport of goods |
A productive industry that is a key contributor to the Scottish economy, is essential to the ongoing success of Scotland as a trading nation and that is also an essential transport interface between land and sea |
|
III |
Accurate records kept of cargo tonnages moved at each port and about movement of passengers |
|
Tonnage of dredge spoil disposed of at sea |
Around most of the Scottish coast in specific locations |
Requirement to keep ports open and operational |
Local effects at disposal sites; potential re-distribution of pollutants |
III |
Closely monitored and highly regulated |
Aggregate extraction
Aggregate extraction is the process of taking sand and gravel from the seabed for the making of concrete or for providing sand for land reclamation. Traditionally the industry has been very small in Scotland due to an adequate land supply and lack of suitable and easily accessible resources on the seabed. Two licensed production areas exist; one of which lies in the Firth of Forth for the extraction of up to 6,000,000 m 3 over 10 years. In 2005, 129,387 tonnes (86,260 m 3) was removed to supply infill material for the Leith Western Dock Reclamation Project. This is the only extraction to date. A second area exists in the Firth of Tay (East Scotland Coast) and although this region has not been used for several years it could supply 66,000 m 3per year. The Crown Estate publishes an annual report of aggregate extraction around the UK(20).
Aggregate dredging activity is subject to the approval of the Scottish Government who will require compliance conditions and that an Electronic Monitoring System is used to monitor the location of dredging. Further monitoring of the physical (sediment plume and bathymetry of the seabed), chemical (seabed sediment chemistry) and biological (benthic habitats and species; commercial fisheries; seabirds) effects of dredging also take place.
There are no Government targets for marine aggregate extraction.
Summary Assessment
Parameter |
Geographical region |
Key factors & pressures |
What the evidence shows |
Trend |
Status now |
Confidence in assessment |
Reason for overall status |
|---|---|---|---|---|---|---|---|
Tonnage of aggregate extracted |
Specified locations in the Firth of Forth and Firth of Tay |
Demand for infill and aggregate |
There is relatively low demand |
|
III |
Accurate records kept of extraction |
Leisure, recreation and the historic heritage
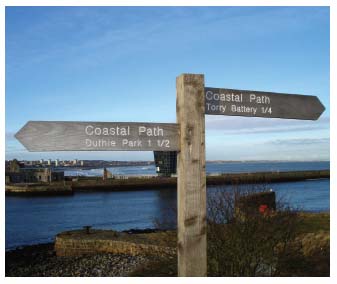
Leisure, recreation and Scotland's historic heritage are important parts of our economy. Scotland has a magnificent coastline and it is used widely for leisure and recreational pursuits including coastal footpaths (Figure 5.14). To estimate the value of all this activity to the economy and assess a measure of productivity is not easily achieved. Economic and employment statistics for coastal tourism, for instance, are not separated out in the wider tourism statistics. In the same way, figures are not centrally available for the overall value of marinas or moorings to the economy. Cruise ship visits to the Scottish coast have been increasing in recent years but the value of these visits is not identifiable.
However, specific studies at a local scale provide an indication of the economic value of particular sectors. For example, the coastal and underwater natural heritage attracts visitors and recreational divers to areas such as Orkney. Recreational diving has been calculated to contribute more than £1.5 million to the local economy of Orkney (see Table 5.12). See Case Study 5.4.
The Firth of Clyde and the west coast lochs are popular sailing destinations with a number of established marinas. New marinas have emerged in recent years on the east coast as small fishing harbours look to diversity and satisfy a growing demand.
The British Marine Federation ( BMF) publishes key performance indicators for the UK leisure and small commercial marine industry. In its 2006/2007 report (21) (published January 2008 and updating earlier work) it estimates the total UK industry revenue to be £2,952 million, with a Value Added of £1,053 million (35.7% of turnover) with Scotland's share being £98.9 million (3.4% of the UK) and VA £35.3 million, quite significant figures. The report also estimates full-time equivalent employment to be 1,816 for Scotland. Scotland may be able to generate more revenues in this sector and it may be currently underexploited.
In 2006, a report (22) for Scottish Enterprise and Highlands & Islands Enterprise which investigated the potential for future development in the Clyde Estuary said that "Scotland is hailed as one of the top six sailing destinations in the world … The main reasons given for sailing in the Clyde are scenery, safe waters, islands, uncrowded areas and the quality of the sailing". The report also concluded that "it would not be unreasonable to use a figure of £250 million as a conservative estimate of the current total economic value of the marine leisure industry to Scotland".
Recreational use of Scotland's seas is not without environmental impacts. Surveys of Loch Creran have identified damage on the seabed reefs. However, a management initiative to bring stakeholders together and develop good practice is set to address the problems (see Case Study 5.5).
Figure 5.14 Coastal footpath signpost
Summary Assessment
Parameter |
Geographical region |
Key factors & pressures |
What the evidence shows |
Trend |
Status now |
Confidence in assessment |
Reason for overall status |
|---|---|---|---|---|---|---|---|
Economic value of marine leisure activities |
Scottish continental shelf but mainly within firths, and sea lochs |
Highly regarded for scenery and safe waters |
A healthy and expanding industry |
|
II |
Data for Scotland as a whole are poor but local and general assessments are very positive |
CASE STUDY 5.4 Coastal and marine historic heritage
Scotland's coasts and seas have provided a source of food and energy, a means of defence from invasion, and a springboard for trade and communication between neighbouring communities and across oceans. The material remains of this historical association with the sea can be found at the coast edge and far out to sea.
Since the last Ice Age, the coast edge and sea bed have undergone constant change which continues to this day. For example, once-terrestrial sites may now be submerged; once-marine sites may now be on land. Fish-traps and crannogs in the intertidal zone experience cyclical inundation and exposure by tides, while lighthouses and harbours extend from dry land into the sea.
The wrecks of ships and aircraft, sometimes far offshore, are part of a wider maritime cultural landscape that may extend inland. For shipwrecks, this might encompass the yards where they were built, the ports they served, the lighthouses they passed, and the routes they crossed.
About 30% of the coast and foreshore has been surveyed as part of Historic Scotland's Coastal Zone Assessment programme (23) (Table 5.11). Extrapolation suggests about 38,000 historic buildings and monuments spanning 9,000 years of human activity lie close to our coasts. Underwater, 15 of the most important historic wreck sites so far discovered have statutory protection by law (Figure 5.15).
Table 5.11 Royal Commission on the Ancient and Historic Monuments of Scotland ( RCAHMS) maritime records (correct to April 2006), and Historic Scotland statistics on sub-tidal scheduled/designated marine historic assets
Headline indicator |
Number |
|---|---|
Total number of RCAHMS maritime records [D] |
12,049 |
Identified sites where demonstrable remains have been identified |
1,425 |
Historical references of a casualty at sea, some with only a vague location identifier |
10,223 |
Recorded seabed obstructions (e.g. fishermens' net fastenings or other obstructions) |
297 |
Aircraft |
61 |
Numbers of subtidal marine historic assets with statutory protection [E] |
15 |
Scheduled under the Ancient Monuments and Archaeological Areas Act 1979 |
2 monuments comprising |
Designated under the Protection of Wrecks Act 1973 |
8 |
Source: www.pastmap.org
Figure 5.16 Multi-beam sonar image of SMS Koln, Scapa Flow, Orkney Islands

Scotland's marine historic environment has a positive contribution to make to the economic, social and cultural fabric of today's Scotland whether by direct visitor enjoyment of the remaining wrecks of the German High Seas Fleet scuttled in Scapa Flow in 1919 (Figure 5.16), or simply by understanding that remains dating the earliest recorded human occupation may be found at the coast edge (Figure 5.17) or further offshore.
Historic Scotland's recent review of existing information provides possible headline indicators for the historic environment as a whole (24). Its 14 staffed coastal and maritime properties in care attracted over 310,000 visitors and generated on-site income of £1.4 million in 2006/7, with indirect local employment and income benefits. Skara Brae, the most complete Neolithic village in NW Europe and part of a World Heritage Site, attracts over 60,000 visitors per year. There are few published figures of the 'economic value' of the subtidal heritage. However, shipwrecks are a significant attraction for many of the 6,000 or more recreational divers based in Scotland, and thousands more who visit from further afield (25). Table 5.12 indicates their contribution to the economy of the Orkney Islands.
Historic assets on the seabed introduce both positive and negative effects on the marine environment. Wrecks can act as artificial reefs supporting diverse communities of marine wildlife. Conversely, in some cases there is a risk of oil leakage such as that from HMSRoyal Oak in the Orkney Islands, which is subject to routine monitoring.
Sea level rise and increased storminess threaten the integrity of numerous coastal sites such as Skara Brae [F]. Our marine historic assets are similarly susceptible to the effects of wave and tidal energy, and factors such as seabed sediment type, slope of seabed, water salinity and acidity/alkalinity, and levels of oxygenation. Marine historic assets can be at risk too from human activities such as construction projects, cable laying, salvage, dredging and fishing.
Techniques to investigate underwater sites remain in their infancy and less is known about marine historic assets than those on land. This is particularly true for submerged landscapes for which there is considerable potential, notably around the Western and Northern Isles. The majority of 'maritime records' relate to losses of ships but with no known seabed location. Enhancement of this knowledge base would greatly facilitate efforts to safeguard Scotland's most important marine historic assets.
Table 5.12 Economic figures for Orkney Islands
Subject |
Headline Indicator |
Value |
|---|---|---|
Visitor access |
Numbers of visitors to the scheduled German Fleet wrecks in Scapa Flow each year |
2,500-3,500 |
Numbers of dives on the scheduled wrecks in 2006 |
14,415 |
|
Contribution to economy |
Numbers of jobs directly connected with historic wreck tourism in Orkney |
>20 |
Contribution by divers to the Orkney economy |
8% of tourist revenue to Orkney |
Source: Forbes, 2003 ScapaMap 2000-2002; Forbes, 2008, ScapaMap 2001-2006. Copies archived with RCAHMS, 16 Bernard Terrace, Edinburgh EH8 9NX.
Summary Assessment
Parameter |
Geographical region |
Key factors & pressures |
What the evidence shows |
Trend |
Status now |
Confidence in assessment |
Reason for overall status |
|---|---|---|---|---|---|---|---|
Condition of historic environment |
Coast edge and foreshore |
Coastal erosion and development pressure |
Numerous sites/areas at risk |
|
III |
30% sample biased towards known high-risk areas |
|
Knowledge of marine historic environment |
Sub-tidal zones |
Shortage of quality data and/or access to it |
Potential for submerged terrestrial sites in places, numerous wrecks of ships, aircraft and associated sites |
|
I |
The existing record is an indicator of seabed archaeology; only a very few sites have been recorded in detail |
Figure 5.15 Scheduled wrecks and designated sites in Scottish waters
Figure 5.17 Late Bronze Age logboat recovered in 2006 from the Tay Estuary
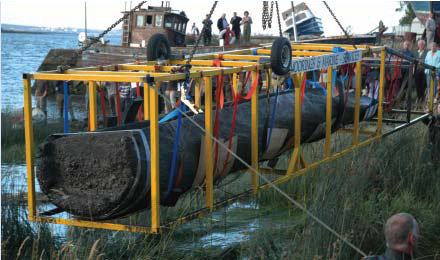
CASE STUDY 5.5 Competing activities in the Loch Creran marine Special Area of Conservation
Loch Creran is a relatively small but important loch in Argyll which has many economic activities occurring within it (e.g. fish and shellfish farming, fishing, recreation/marinas, ferry terminal for coastal quarry, local marine industry). Scientists from various institutes, including Heriot-Watt University and SAMS, have carried out numerous studies in the loch. The data produced has helped to justify the designation of the area as a marine SAC and to guide its management.
The presence of spectacular but fragile serpulid reefs (Figure 5.18) was one of the principal reasons for Loch Creran being designated as a marine SAC under the EC Habitats Directive (92/43/ EEC) in 2005. Serpulid reefs have also been identified as a priority habitat by the UK Government's Biodiversity Action Plan ( UK action under the UN Convention on Biological Diversity) and are on the Scottish Biodiversity List. In UK waters only Serpula vermicularis L. is known to form extensive subtidal reefs. Such reefs were reported to occur in Loch Sween, Scotland in 1975 although a number of subsequent unpublished surveys have revealed that only dead reef fragments now remain.
The only published records confirming the presence of living S. vermicularis reefs in the UK are for Loch Creran, Scotland (26-32), although in 2006 an area supporting a large number of smaller patches was discovered in Loch Teacuis, mid-west Scotland. Other known locations of these rare biogenic S. vermicularis reefs include Ardbear Lough and Killary Harbour in Ireland and Mar Piccolo di Taranto, Italy (33) although the reefs in Loch Creran are by far the most extensive.
Careful management is required to support all of Loch Creran's competing economic activities, and to maintain its biological health and conservation status. The Argyll Marine SACs Management Forum, coordinated by Argyll and Bute Council, was established in 2003 and includes representatives of all stakeholders, with independent scientific advice provided by Heriot Watt University and SAMS. Notable successes of the management process include the production of a Private and Commercial Moorings Pack and an anchoring leaflet to ensure that moorings and anchors are placed where they will not damage serpulid reef (Figure 5.19). In addition, zoning of fishing activities to protect the serpulid reefs and horse mussel beds has been achieved through the Inshore Fishing (Prohibited Methods of Fishing) (Loch Creran) Order 2007: SSI No. 185.
Figure 5.18 A typical ovoid-shaped patch reef of Serpula vermicularis
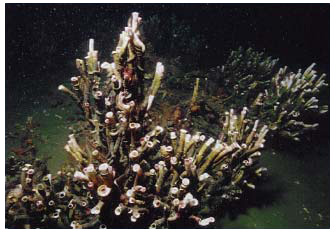
Figure 5.19 Dense reef rubble resulting from mooring damage
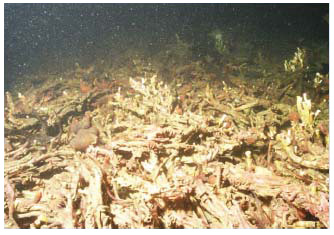
Summary Assessment
Parameter |
Geographical region |
Key factors & pressures |
What the evidence shows |
Trend |
Status now |
Confidence in assessment |
Reason for overall status |
|---|---|---|---|---|---|---|---|
Conservation Status of Biogenic Reefs |
Loch Creran, Argyll & Bute |
Fish dredging and vessel mooring |
Limited damage to fragile reefs but now protected |
|
III |
Sufficient available, quality assured data |
Marine renewable energy industry
Scotland has one of the best environments anywhere in the world for generating offshore renewable energy. The northern and western coastlines, and island areas, offer huge opportunities for the generation of wave and tidal energy. The eastern coast and further offshore provide strong offshore wind potential. It is not surprising that attempts are being made to harness this abundant renewable resource. At present there is a small number of offshore renewable energy installations in this emerging area but technology and projects are evolving quickly. Existing projects in Scotland include:
- Beatrice offshore wind demonstrator - Part of the DOWNViND project, this demonstrator has located wind turbines 25km from the Scottish shoreline and is the world's deepest offshore wind project. The 2 wind turbines with a capacity of 10 MW, power the Beatrice oil platform in Moray Firth (Figure 5.20).
- European Marine Energy Centre (Orkney) - EMEC provides custom test facilities for the wave and tidal energy sector. The Centre has four wave energy berths and five tidal energy berths. Several devices have already been tested at EMEC with more expected through 2008.
- LIMPET is a shoreline wave energy generator located on Islay. It produces electricity which is supplied to the National Grid and was the world's first commercial-scale wave energy device that generates wave energy for the grid.
Construction has started on the Robin Rigg Offshore wind farm in the Solway Firth. This will have a capacity of 216 MW. A small number of projects are at the planning stage including the Siadar Wave Energy Scheme, a 4 MW active breakwater device proposed for Siadar in Lewis and the Aberdeen offshore wind farm, a 165 MW proposal.
The environmental impact of renewable energy installations is considered as part of the initial consenting regime. In addition, there is a requirement for ongoing pre- and post-construction environmental monitoring, an example of this is the Robin Rigg Monitoring Group. Data on the level of production, economic activity and number of people employed are not currently collected. Figures are included as part of the overall energy sector.
In November 2007 the Scottish Government announced an increase in renewable electricity targets. Ministers want 31% of Scotland's electricity to come from renewable sources by 2011, and they have set a target of 50%, up from 40%, of all electricity from renewables by 2020 (34). Ministers are also committed to seeing 10 MW of wave and tidal energy deployed by 2010 (35). In addition, an SEA(36,37) for wave and tidal energy has identified what some of the likely environmental impacts of marine energy will be. Further work on environmental impact and locational guidance will be taken forward in response to the SEA.
Figure 5.20 Beatrice offshore wind demonstrator
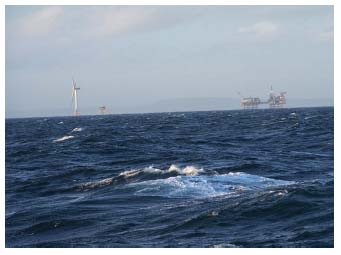
Summary Assessment
Parameter |
Geographical region |
Key factors & pressures |
What the evidence shows |
Trend |
Status now |
Confidence in assessment |
Reason for overall status |
|---|---|---|---|---|---|---|---|
Megawatts of power; number of experimental power generation systems tested |
Wind and wave: Offshore around most of the Scottish coast Tidal: specific sites |
Government targets to achieve targets for renewable energy |
High level of activity in the development and installation of new capacity |
|
III |
Technological challenges remain. Uncertain environmental effects. |
Other activities
There are a number of other activities that take place in the coastal and marine environment and contribute to the marine economy of Scotland. To develop a comprehensive assessment of the productivity of Scotland's seas requires them all to be considered. The next section briefly describes what could be included. All of these will be considered further to determine how much can be included in the 2010 report.
Ship and boat building and repairs - the once large industry for which Scotland was famous and the term Clyde Built meant quality, is now a shadow of its former self. However, a number of shipyards remain that provide important economic activity. The Input-Output approach includes some details of this sector.
Shipping operations, navigation and safety - this could include Scottish seafarers, value of Scottish shipping company operations and the work of various safety organisations in Scotland, although many of these are not Scottish-based.
Construction industry - construction projects such as port extensions, new jetties, coastal defence and coastal flood protection work and building of offshore renewable energy projects are economic activities that are marine-based. However, economic details of such, usually one-off, projects are not collected. Their ongoing value to the Scottish economy would be included in the statistics for the main activity, for example, ports.
Telecommunications industry - the Scottish seabed is covered by a large network of both inter-island (domestic) and transcontinental (international) telecommunication cables. Marine economic activity is created during the laying operations of the cable laying ships. It is uncertain as to how much of the economic value of the traffic that passes through such cables could be attributed to the value of the marine economy.
Defence - the Ministry of Defence has a number of large Scottish coastal bases. These will have a local economic value that could be attributed to the marine economy, since without the sea the bases would not exist.
Business services - these usually include activities such as ship finance, ship broking and chartering. The extent of these in Scotland has not been investigated for this report.
Licence and rental - a payment is usually made for development activity on the foreshore and the seabed to its owner, whether this is the Crown Estate (the largest such owner) or one of the many other owners. This creates economic value but has not been included in this report.
Marine research and development and education - Scotland has some world class centres which create economic value which has not been investigated for this report.
Marine environment - this could include the operation of coastal waste water treatments plants, in future the decommissioning of oil and gas platforms and the work of Scotland's environmental organisations such as FRS, SEPA and SNH.
WHAT GAPS ARE THERE IN OUR KNOWLEDGE?
Assessing whether the seas are productive requires a comparison between current levels of production and agreed target levels. It is apparent that except for fishery quotas, which are a form of target, targets are not set for human activities. It is normal that activity responds to market forces. As such, this initial assessment has many gaps, in particular assessing "are the seas being productive enough?". Equally, the various sectors have responsibility for their own statistics of levels of activity that have been collected in a similar way for many years. Comparing sector by sector is therefore not possible and also raises the question "would it be appropriate to do so anyway?".
Currently statistics are collected based on a variety of geographical areas, compare the fisheries catch statistics with the ACOPS oil spill figures for example. If an integrated assessment of the seas is to report on the basis of the areas in chapter 1, then a method is needed to reconcile the various reporting mechanisms.
Another gap is the difficulty in identifying the economic value of the seas to Scotland. This assessment has included in the Input-Output Table approach, figures derived from government economic statistics. Individual industries may not always agree that this gives a full assessment of their particular industry.
Detailed knowledge of the impact of some sectors on the marine environment remains a gap as is the lack of contribution to this report from the many sectors identified. To give a comprehensive overview of both the economic benefits and the environmental impacts of the various activities, a wide engagement will be required with industry for the State of Scotland's Seas in 2010.
CONCLUSION
There is little doubt that Scotland's seas are productive. In 2006 379,200 tonnes of live fish worth £368.5 million was landed; about 150,000 tonnes of salmon and shellfish farmed worth about £280 million; a significant share of the UK's 70 million tonnes of oil and 84 million cubic metres of gas produced in waters off Scotland; a total cargo of 101.5 million tonnes handled at all Scottish ports and about 10 million passengers carried on ferries. Analysis of the Scottish Government Input-Output tables show that in 2004, the total value to the Scottish economy of the identified marine related industries was estimated to be £2.2 billion and employing around 50,000 full time equivalent employees. This represents 2.6% of the total Scottish GVA (£83 billion) and 2.4% of total Scottish full time equivalent employment (around 2 million). Overall, all these figures demonstrate productivity but not a measure of 'how productive Scotland's seas could be' nor indeed 'whether this level of productivity is sustainable'.
In addition, there was much activity at the coast with many visitors to historical sites and a new renewable energy industry emerging. There are also many activities, such as ship and boat building that this report has not investigated. Data about the impacts of some activities have been identified, for example aquaculture, and the number of spills from shipping and oil activity is carefully monitored (458 in 2005) but from the case study in Chapter 3 the impact of oil production is shown to be limited. Scotland has many active ports but only 1.7 million tonnes of dredge spoil deposited in 2006. Moorings can have damaging effects as the photograph in case study 5.2 shows but management arrangements can be put in place to mitigate this for the future.
Contact
Email: Central Enquiries Unit ceu@gov.scot
There is a problem
Thanks for your feedback