Analysis of Religion in the 2001 Census
The report explores the characteristics of each of the religion groups in Scotland using information collected from the 2001 Census in Scotland.
ANALYSIS OF RELIGION IN THE 2001 CENSUS: Summary Report
4. LABOUR MARKET
Economic Activity
The economic activity rate represents the number of people who are either in employment or unemployed as a proportion of the total working age population. The 2001 Census definition is consistent with the International Labour Office (ILO) definition, which includes all people of working age who were working, all those who where not working but were looking for work and were available to start within 2 weeks (the unemployed), and full-time students who were economically active. The working age population consists of women aged between 16-59 years and men aged between 16-64 years.
Chart 4.1: Economic Activity Rate by current religion - All People aged 16-pensionable age 10
Percentages
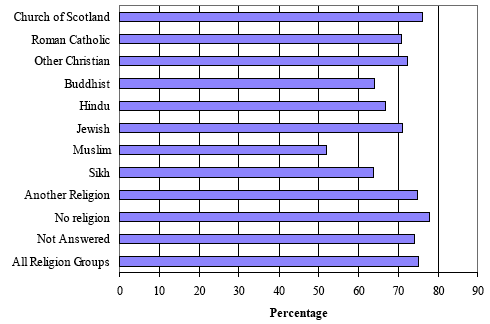
Chart 4.1 shows that Muslims are least likely to be economically active with just over half (52%) of those of working age being in employment or unemployed and seeking employment. This is primarily due to the lower rates for Muslim women. Around 64% of Sikhs and Buddhists are economically active. Those persons who have no religion are most likely to be economically active (78%). This is closely followed by people who report their religion to be Church of Scotland with over three-quarters (76%) being economically active. In contrast, 71% of Roman Catholics are in employment or unemployed (but seeking employment).
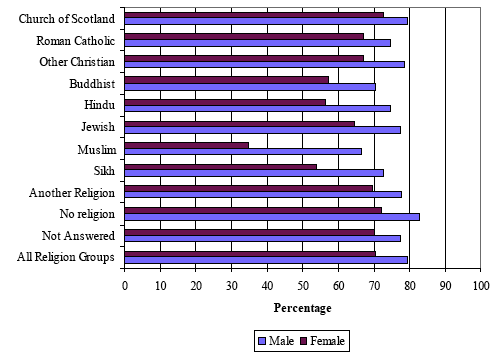
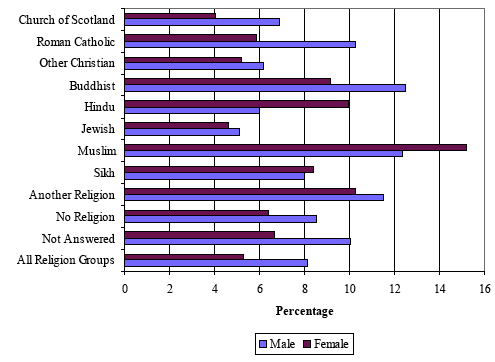
The economic activity rates for men and women are shown in Chart 4.2. Across all religion groups, men are more likely to be economically active than women. The difference between the economic activity rate of men and that of women is greatest for the Muslim group. Around two-thirds of Muslim men (67%) are economically active, while only 35% of Muslim women are in employment or unemployed (but still seeking employment). There are also large differences between Hindu and Sikh men and women in terms of their economic activity rates.
The differences in economic activity rates between men and women are smallest for the Church of Scotland group and Roman Catholics.
Chart 4.2: Economic Activity Rate by sex and current religion - All People aged 16-pensionable age
Percentages
The employment rates for each of the different religion groups are shown in Chart 4.3.
Chart 4.3: Employment Rate by current religion - All People aged 16-pensionable age
Percentages
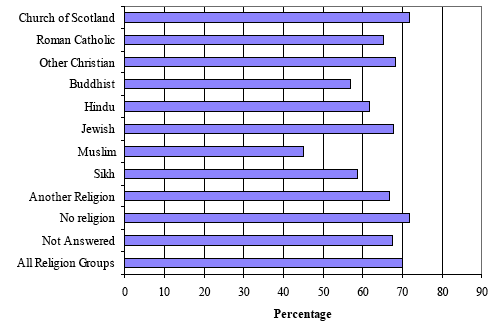
As can be expected, the employment rates show a similar pattern to the economic activity rates, with Muslims again having the lowest employment rate with less than half (45%) of those of working age being in employment. Those people with a religious affiliation to the Church of Scotland and those with no religion are most likely to be employed with both groups recording employment rates of 72%. Roman Catholics report an employment rate of 65%.
Chart 4.4 shows how the employment rate differs between men and women for each of the religion groups.
Chart 4.4: Employment Rate by sex and current religion - All People aged 16-pensionable age
Percentages
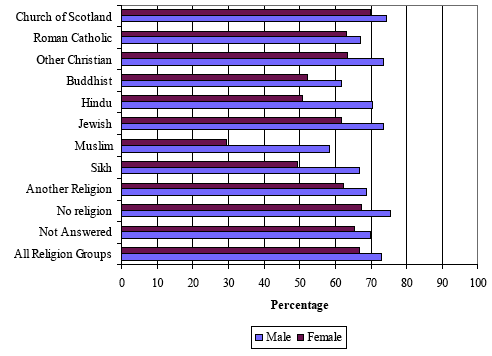
The largest difference in employment rates between men and women is seen in the Muslim group. There are 58% of Muslim men in employment compared to only 29% of Muslim women.
The differences between men and women in terms of their employment rates are smallest for the Roman Catholic group (67% of men compared to 63% of women are in employment) and the Church of Scotland group (74% of men and 70% of women are in employment).
Unemployed
As explained previously, people are defined as unemployed if they are not working but they are available to start work in the next 2 weeks and have either looked for work in the past 4 weeks or are waiting to start a new job.
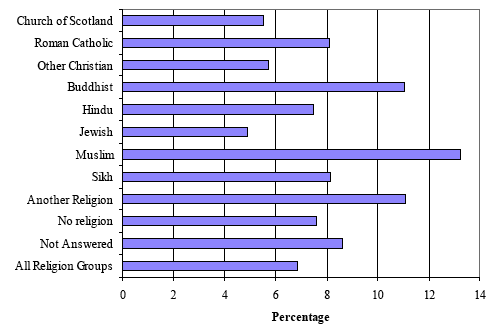
Muslims have the highest unemployment rate at 13% (Chart 4.5). This is followed by Buddhists and those reporting Another Religion with 11% of both groups unemployed.
The lowest unemployment rate is in the Jewish group at 5%. People from the Church of Scotland and Other Christian groups also have low unemployment rates at 6%. There are 8% of Roman Catholics unemployed.
Chart 4.5: Unemployment Rate by current religion - All Economically Active People aged 16-pensionable age
Percentages
The difference between the proportion of men and women being unemployed can be seen from Chart 4.6.
Chart 4.6: Unemployment Rate by sex and current religion - All Economically Active People aged 16-pensionable age
Percentages
For most of the religion groups, men are more likely to be unemployed than women. There are, however, some exceptions with there being higher proportions of Muslim, Hindu and Sikh women unemployed.
Muslim women are most likely to be unemployed at 15%. Those least likely to be unemployed are women from the Church of Scotland (4%).
Chart 4.7 shows the proportion of men and women who have never worked. For all religion groups, there are a higher proportion of women who have never worked compared to men. However, the differences are greater for some groups.
Chart 4.7: People who have never worked by sex and current religion - All People aged 16-pensionable age
Percentages
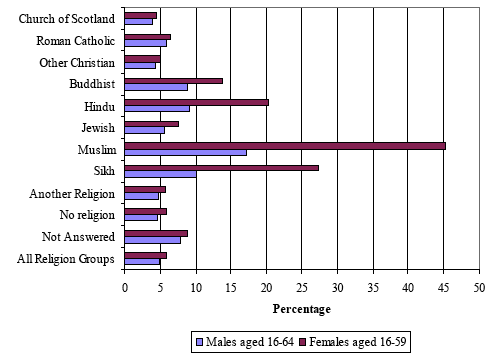
For the Christian religions there is very little difference between men and women in terms of the proportions who have never worked. Four per cent of men from the Church of Scotland and Other Christian religions have never worked. This increases to 5% for women reporting the same religions.
In contrast, there are large differences between the sexes for Muslims, Sikhs and Hindus. For example, 45% of Muslim women have never worked, while the comparable figure for Muslim men is 17%.
Self-Employed
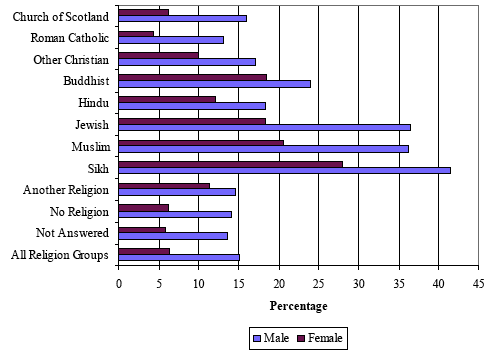
Around a third of Sikhs are self-employed, giving this group the highest self-employment rates. Muslims and Jews are the next most likely to be self-employed with 29% and 27% respectively in self-employment.
Those least likely to be self-employed are Roman Catholics with just over 8% being self-employed.
Chart 4.8: Percentage of those in employment who are self-employed by current religion - All People in Employment aged 16-pensionable age
Percentages
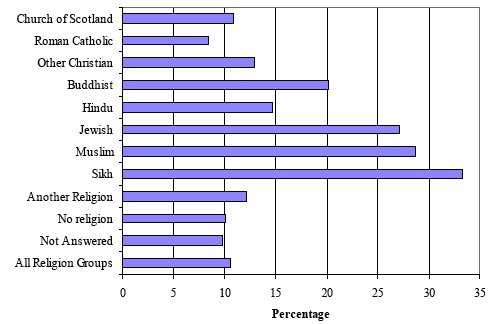
Table 4.1 shows for all people of working age in self-employment whether the business has any employees and also whether those in self-employment work full-time or part-time hours.
The majority of all self-employed people in Scotland work full-time hours with no employees (44%).
Chart 4.8 showed that Sikhs and Muslims are most likely to be self-employed. Both of these groups are most likely to work full-time and have employees.
Information on the proportion of men and women who are self-employed can be found in Chart 4.9. For all religions, men are more likely to be self-employed compared to women. Overall, 15% of men in Scotland are self-employed compared to 6% of women. The largest difference is found in the Jewish group, where 36% of men are working as self-employed compared to 18% of Jewish women.
Table 4.1: Self-employed by whether or not business has any employees and hours worked (full-time or part-time) by current religion - All People aged 16-pensionable age who are Self-Employed excluding Full-Time Students
Row percentages
Self-employed with employees, Part-time |
Self-employed with employees, Full-time |
Self-employed without employees, Part-time |
Self-employed without employees, Full-time |
Base |
|
Church of Scotland |
5 |
39 |
13 |
43 |
97,544 |
Roman Catholic |
5 |
39 |
12 |
44 |
27,963 |
Other Christian |
6 |
32 |
21 |
41 |
19,046 |
Buddhist |
4 |
44 |
23 |
29 |
646 |
Hindu |
11 |
57 |
8 |
24 |
381 |
Jewish |
6 |
47 |
16 |
30 |
669 |
Muslim |
8 |
61 |
6 |
24 |
3,515 |
Sikh |
8 |
62 |
4 |
26 |
828 |
Another Religion |
4 |
27 |
22 |
47 |
1,809 |
No religion |
4 |
33 |
16 |
47 |
68,628 |
Not Answered |
5 |
35 |
15 |
46 |
9,111 |
All Religion Groups |
5 |
37 |
14 |
44 |
230,140 |
Chart 4.9: Proportion of men and women in employment who are self-employed by current religion - All People in Employment aged 16-pensionable age
Percentages
Size of Organisations
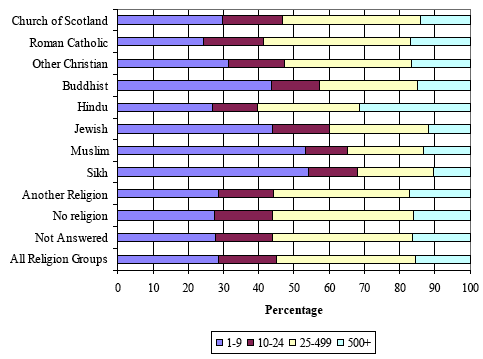
Chart 4.10 shows that over half of Sikhs (54%) and Muslims (53%) work in organisations with less than 10 employees. This may be explained by the high levels of self-employment within these religion groups.
Chart 4.10: Size of organisation by current religion - All People aged 16-74 in Employment
Percentages
Occupation and Industry of Employment
Table 4.2: Occupation of Employment by current religion - All People aged 16-74 years in Employment
Row percentages
Managers and senior officials |
Professional Occupations |
Associate Professional and Technical Occupations |
Adminis-trative and Secretarial Occupations |
Skilled Trades Occupations |
Personal Service Occupations |
Sales and Customer Service Occupations |
Process, Plant and Machine Operatives |
Elementary Occupations |
Base |
|
Church of Scotland |
12 |
9 |
13 |
14 |
13 |
8 |
8 |
10 |
13 |
936,681 |
Roman Catholic |
11 |
10 |
14 |
13 |
11 |
8 |
9 |
10 |
14 |
343,010 |
Other Christian |
15 |
16 |
18 |
12 |
9 |
8 |
7 |
6 |
10 |
154,033 |
Buddhist |
14 |
20 |
18 |
7 |
14 |
5 |
6 |
4 |
11 |
3,325 |
Hindu |
14 |
45 |
12 |
7 |
3 |
3 |
8 |
2 |
7 |
2,698 |
Jewish |
25 |
26 |
16 |
10 |
4 |
4 |
7 |
3 |
5 |
2,686 |
Muslim |
25 |
13 |
8 |
6 |
9 |
3 |
20 |
4 |
10 |
12,610 |
Sikh |
28 |
8 |
7 |
9 |
11 |
3 |
18 |
6 |
10 |
2,579 |
Another Religion |
13 |
17 |
20 |
11 |
9 |
5 |
10 |
5 |
11 |
15,573 |
No religion |
12 |
12 |
15 |
12 |
12 |
6 |
9 |
9 |
12 |
690,860 |
Not Answered |
12 |
10 |
14 |
13 |
12 |
7 |
9 |
10 |
13 |
97,226 |
All Religion Groups |
12 |
11 |
14 |
13 |
12 |
7 |
9 |
10 |
13 |
2,261,281 |
Sikhs are most likely to describe themselves as having occupations that can be classified as 'managers and senior officials' with 28% giving this response. A quarter of Muslims and Jews also consider themselves to be a manager or senior official. These results could again be influenced by the high levels of self-employment within these religion groups.
Within the Hindu group, 45% of people are in professional occupations. This is not surprising given that Hindus are the most highly qualified; Section 3 showed that Hindus have the highest proportion of people educated to degree level or above.
The Church of Scotland and Roman Catholic groups have the highest proportion of people in elementary occupations such as farm workers, construction labourers, packers and the like; 13% and 14% respectively. In contrast, Jewish people are least likely to have such occupations at 5%.
Table 4.3 shows the breakdown of employment by industry for each religion group.
Table 4.3: Industry of Employment by current religion - All People aged 16-74 years in Employment
Row percentages
A |
B |
C |
D |
E |
F |
G |
H |
I |
J |
K |
L |
M |
N |
O,P,Q |
Base |
|
Church of Scotland |
3 |
.. |
.. |
14 |
.. |
8 |
15 |
5 |
7 |
5 |
10 |
7 |
7 |
13 |
5 |
936,681 |
Roman Catholic |
.. |
.. |
.. |
13 |
.. |
8 |
14 |
6 |
7 |
5 |
10 |
7 |
8 |
13 |
5 |
343,010 |
Other Christian |
2 |
.. |
.. |
10 |
.. |
5 |
12 |
6 |
5 |
4 |
13 |
9 |
10 |
15 |
6 |
154,033 |
Buddhist |
.. |
.. |
.. |
9 |
.. |
3 |
9 |
19 |
3 |
3 |
13 |
5 |
10 |
16 |
7 |
3,325 |
Hindu |
.. |
.. |
.. |
5 |
.. |
.. |
13 |
6 |
4 |
4 |
18 |
6 |
8 |
28 |
3 |
2,698 |
Jewish |
.. |
.. |
.. |
10 |
.. |
.. |
21 |
5 |
4 |
3 |
19 |
4 |
11 |
12 |
6 |
2,686 |
Muslim |
.. |
.. |
.. |
6 |
.. |
.. |
36 |
16 |
6 |
3 |
9 |
3 |
5 |
9 |
3 |
12,610 |
Sikh |
.. |
.. |
.. |
7 |
.. |
3 |
35 |
18 |
7 |
4 |
8 |
3 |
3 |
8 |
3 |
2,579 |
Another Religion |
.. |
.. |
.. |
10 |
.. |
4 |
13 |
8 |
6 |
6 |
17 |
7 |
7 |
10 |
7 |
15,573 |
No religion |
.. |
.. |
.. |
14 |
.. |
7 |
14 |
6 |
7 |
5 |
12 |
7 |
7 |
11 |
6 |
690,860 |
Not Answered |
.. |
.. |
.. |
13 |
.. |
7 |
15 |
6 |
7 |
4 |
12 |
8 |
7 |
11 |
5 |
97,226 |
All Religion Groups |
2 |
.. |
.. |
13 |
.. |
7 |
14 |
6 |
7 |
5 |
11 |
7 |
7 |
12 |
5 |
2,261,281 |
Note: Any cells representing less than 2% have been marked with "..". They are judged to be insufficiently reliable for publication.
Industry A: Agriculture, Hunting and Forestry
Industry C: Mining and Quarrying
Industry D: Manufacturing
Industry E: Electricity, Gas and Water Supply
Industry F: Construction
Industry G: Wholesale and Retail Trade; Repairs
Industry H: Hotels and Restaurants
Industry I: Transport, Storage and Communication
Industry B: Fishing
Industry J: Financial Intermediaries
Industry K: Real Estate, Renting and Business Activities
Industry L: Public Administration and Defence; Social Security
Industry M: Education
Industry N: Health and Social Work
Industry O,P,Q: Other
The industries which employ the largest proportion of people are Wholesale and Retail trade (14%), Manufacturing (13%), Health and Social Work (12%) and Real Estate, Renting and Business Activities (11%).
Hours Worked
Those most likely to work long hours (49 hours and over) are Sikhs (28%), Muslims (26%) and Hindus (26%). In comparison, only 14% of all people in Scotland work 49 hours or more.
Table 4.4: Hours worked by current religion - All People aged 16-74 in Employment
Row percentages
1-15 hours |
16-30 hours |
31-37 hours |
38-48 hours |
49 hours and over |
Base |
|
Church of Scotland |
7 |
18 |
20 |
40 |
14 |
936,681 |
Roman Catholic |
7 |
18 |
22 |
41 |
12 |
343,010 |
Other Christian |
9 |
18 |
18 |
38 |
16 |
154,033 |
Buddhist |
9 |
18 |
17 |
36 |
20 |
3,325 |
Hindu |
8 |
13 |
17 |
36 |
26 |
2,698 |
Jewish |
10 |
19 |
16 |
36 |
20 |
2,686 |
Muslim |
9 |
21 |
13 |
31 |
26 |
12,610 |
Sikh |
8 |
19 |
13 |
31 |
28 |
2,579 |
Another Religion |
9 |
14 |
20 |
42 |
14 |
15,573 |
No religion |
7 |
16 |
20 |
43 |
14 |
690,860 |
Not Answered |
7 |
16 |
21 |
42 |
14 |
97,226 |
All Religion Groups |
7 |
17 |
20 |
41 |
14 |
2,261,281 |
Socio-Economic Classification
The National Statistics Socio-Economic classification (NS-SeC) is occupationally based and aims to bring together people with similar socio and economic status. Tables 4.5 and 4.6 show the NS-SeC for working age men and women in each of the religion groups.
Table 4.5: NS-SeC by current religion - All Females aged 16-59
Row percentages
Higher Managerial and Professional Occupations |
Lower Managerial and Professional Occupations |
Inter-mediate Occupation |
Small employer and own account workers |
Lower supervisory and technical occupations |
Semi-routine occupations |
Routine occupations |
Never worked and long-term unemployed |
Not classified |
Base |
|
Church of Scotland |
4 |
22 |
17 |
4 |
4 |
19 |
9 |
3 |
18 |
625,266 |
Roman Catholic |
4 |
21 |
15 |
2 |
4 |
18 |
9 |
5 |
21 |
263,992 |
Other Christian |
7 |
24 |
14 |
5 |
3 |
14 |
6 |
3 |
23 |
115,150 |
Buddhist |
8 |
20 |
7 |
8 |
3 |
13 |
6 |
9 |
26 |
2,778 |
Hindu |
19 |
16 |
9 |
5 |
2 |
7 |
3 |
15 |
24 |
1,893 |
Jewish |
11 |
26 |
11 |
7 |
2 |
9 |
2 |
3 |
28 |
1,745 |
Muslim |
4 |
8 |
7 |
7 |
2 |
10 |
3 |
35 |
26 |
12,673 |
Sikh |
4 |
10 |
9 |
13 |
2 |
13 |
6 |
22 |
21 |
2,017 |
Another Religion |
7 |
23 |
13 |
4 |
3 |
12 |
5 |
4 |
29 |
7,686 |
No religion |
6 |
22 |
15 |
3 |
4 |
18 |
10 |
5 |
18 |
443,004 |
Not Answered |
5 |
20 |
16 |
3 |
4 |
18 |
9 |
7 |
19 |
62,876 |
All Religion Groups |
5 |
22 |
16 |
3 |
4 |
18 |
9 |
4 |
19 |
1,539,080 |
Table 4.6: NS-SeC by current religion - All Males aged 16-64
Row percentages
Higher Managerial and Professional Occupations |
Lower Managerial and Professional Occupations |
Inter-mediate Occupation |
Small employer and own account workers |
Lower supervisory and technical occupations |
Semi-routine occupations |
Routine occupations |
Never worked and long-term unemployed |
Not classified |
Base |
|
Church of Scotland |
10 |
18 |
6 |
10 |
14 |
11 |
15 |
4 |
13 |
628,750 |
Roman Catholic |
9 |
16 |
6 |
8 |
12 |
11 |
16 |
5 |
17 |
250,763 |
Other Christian |
18 |
23 |
6 |
9 |
9 |
8 |
9 |
3 |
16 |
102,553 |
Buddhist |
14 |
19 |
4 |
12 |
6 |
10 |
5 |
5 |
25 |
2,966 |
Hindu |
40 |
12 |
4 |
8 |
2 |
4 |
2 |
2 |
26 |
2,407 |
Jewish |
25 |
26 |
4 |
13 |
4 |
4 |
3 |
2 |
19 |
1,953 |
Muslim |
10 |
9 |
3 |
20 |
5 |
14 |
5 |
8 |
26 |
14,995 |
Sikh |
8 |
11 |
4 |
27 |
6 |
13 |
7 |
5 |
20 |
2,308 |
Another Religion |
15 |
20 |
8 |
6 |
8 |
8 |
6 |
3 |
27 |
15,501 |
No religion |
12 |
19 |
6 |
8 |
13 |
11 |
14 |
4 |
13 |
509,835 |
Not Answered |
10 |
17 |
7 |
8 |
12 |
11 |
14 |
6 |
14 |
76,853 |
All Religion Groups |
11 |
18 |
6 |
9 |
13 |
11 |
14 |
4 |
14 |
1,608,884 |
The results from Tables 4.5 and 4.6 show that Hindu men and women are most likely to be working in higher managerial and professional occupations, with 40% of men and 19% of women in these occupations. This may be explained by the high proportion of Hindus (58%) educated to degree level (as shown in Table 3.1).
Over a quarter of Sikh men (27%) and one in five Muslim men (20%) are classified as small employers / own account workers. This is not surprising as Chart 4.8 has already shown that Sikhs and Muslims have the highest proportion of self-employed workers.
A considerable proportion of Muslim and Sikh women have never worked or are classified as long-term unemployed (35% of Muslim women and 22% of Sikh women).
There is a problem
Thanks for your feedback